Fig. 7
Download original image
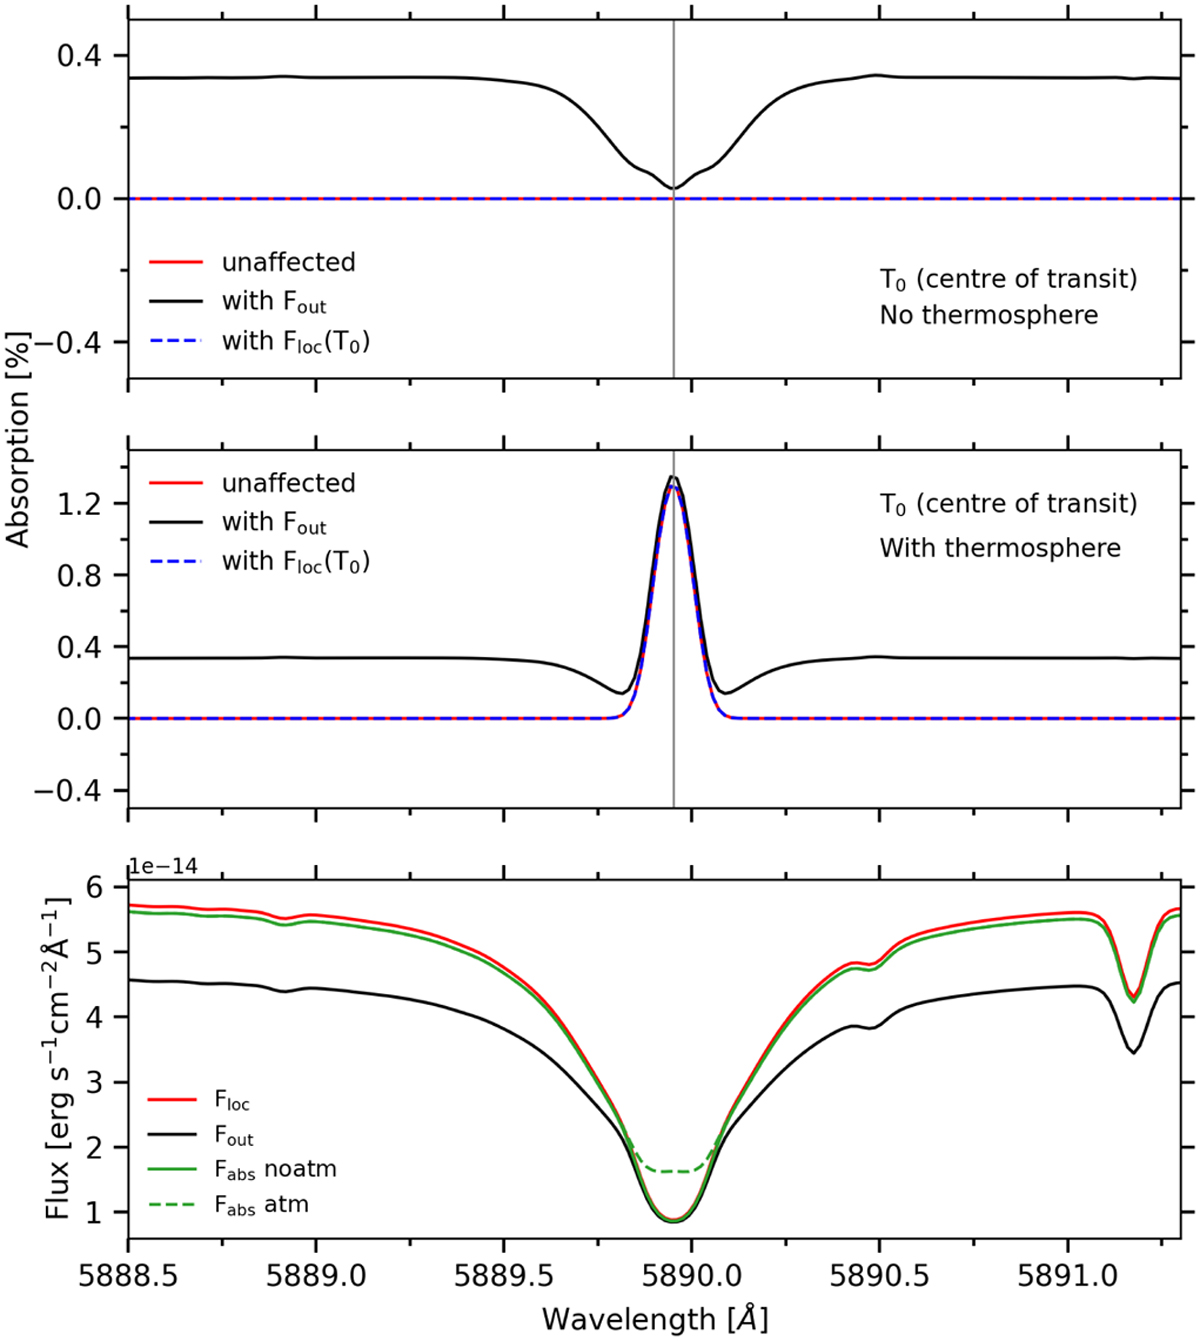
Atmospheric absorption spectra at the centre of the transit as a function of wavelength in the stellar rest frame, for synthetic stellar spectra containing CLVs. Upper panel: absorption spectrum of the planetary disc only. Middle panel: absorption spectrum of the planet with a thermosphere. The black dashed curves were computed using Fout. Blue dashed curves were computed using Floc(T0). Lower panel: quantities used to compute the absorption spectra. We multiplied Fout by the ratio between the occulted surface and the surface of the star to bring it to the level of Floc and make the comparison easier.
Current usage metrics show cumulative count of Article Views (full-text article views including HTML views, PDF and ePub downloads, according to the available data) and Abstracts Views on Vision4Press platform.
Data correspond to usage on the plateform after 2015. The current usage metrics is available 48-96 hours after online publication and is updated daily on week days.
Initial download of the metrics may take a while.