Fig. 6
Download original image
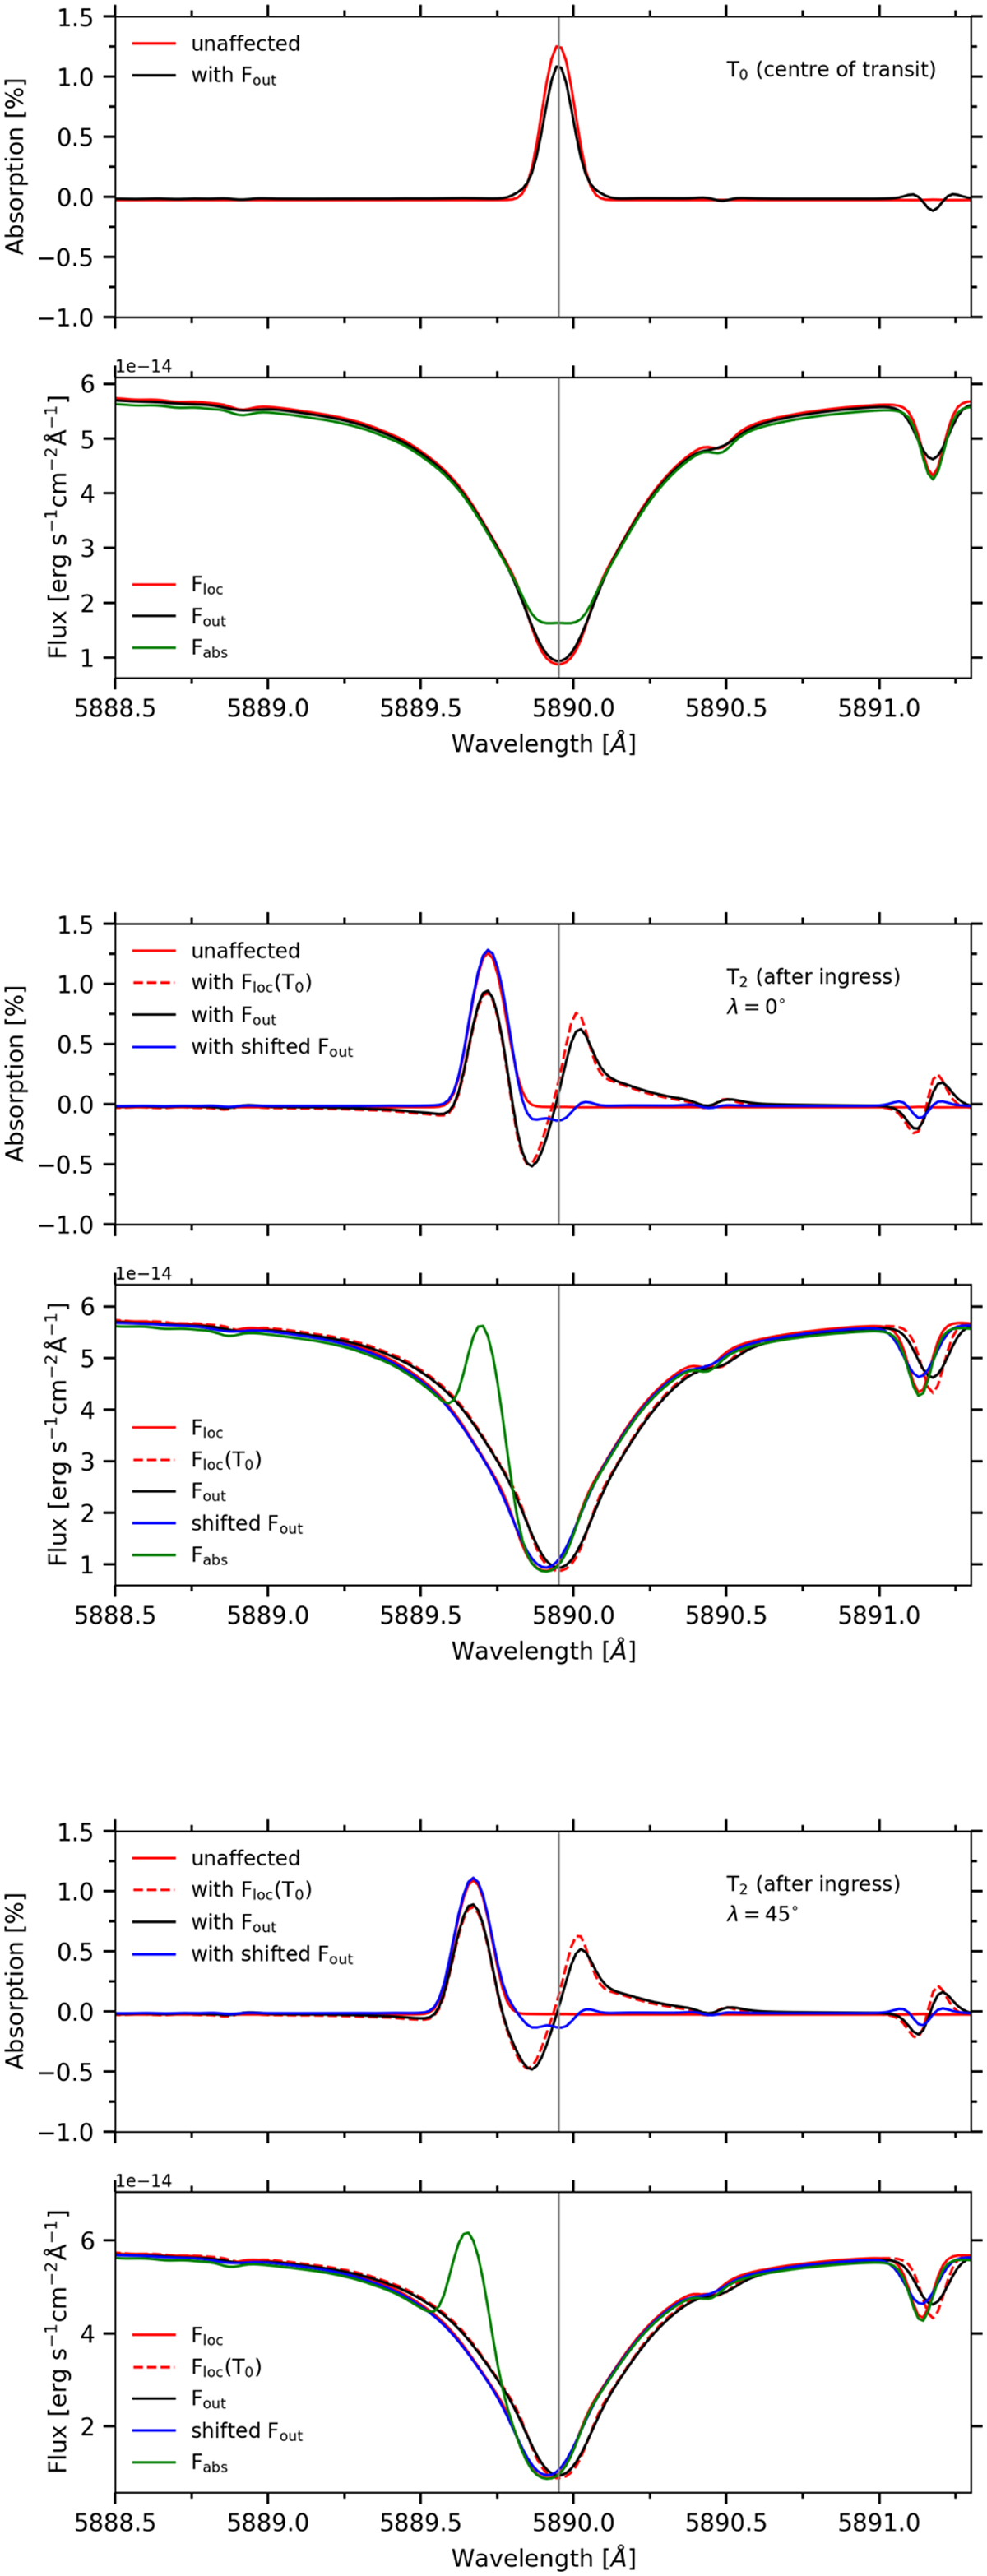
Excess absorption spectra with thermospheric sodium, as a function of wavelength in the stellar rest frame, computed with the different reference spectra mentioned in Sect. 3.1 and for a veq sin(i) = 3 km s−1. Upper panels: excess absorption spectra. Lower panels: quantities used to compute the absorption spectra. Here, Fout was multiplied by the ratio between the occulted surface and the surface of the star to bring it to the level of Floc and make the comparison easier. We show results for different time-steps (T2 and T0) and sky-projected spin-orbit angles (0 and 45°).
Current usage metrics show cumulative count of Article Views (full-text article views including HTML views, PDF and ePub downloads, according to the available data) and Abstracts Views on Vision4Press platform.
Data correspond to usage on the plateform after 2015. The current usage metrics is available 48-96 hours after online publication and is updated daily on week days.
Initial download of the metrics may take a while.