Fig. 3.
Download original image
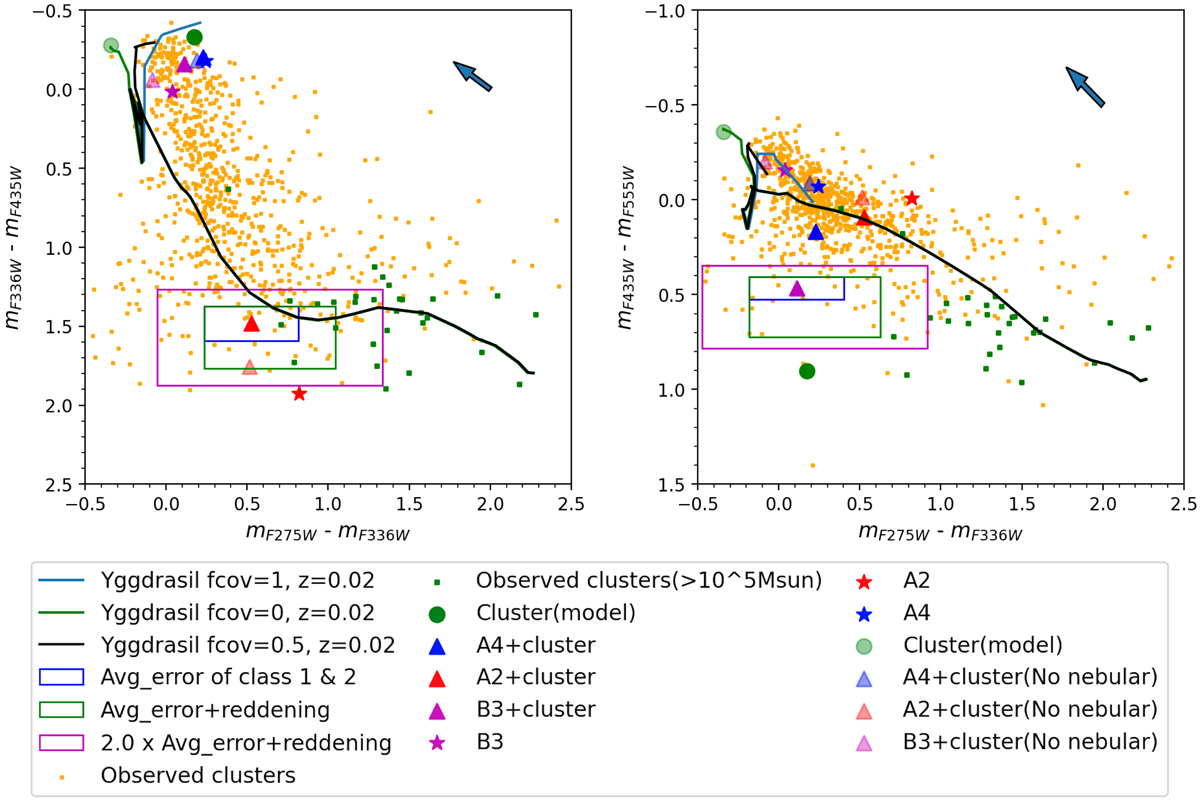
Location of clusters selected for further analysis from NGC 628 in color–color plots. Left: Color–color diagram used for the selection of clusters close to the A2 SMS+Cluster model. Right: Color–color plot for the selection of clusters close to the B3 SMS+Cluster model. Class 1 and Class 2 objects are shown in yellow points while clusters with mass > 105 M⊙ are shown by green squares. Yggdrasil models with solar metallicity and different covering factors are shown as blue (fcov = 1), black (fcov = 0.5), and green (fcov = 0) lines (fcov is important only at young ages (< 10 Myr) and all three models will be the same at older ages and are therefore seen as a single black line). The model cluster is shown as a large green dot. Different SMS+Cluster and SMS models are shown in red (A2), blue (A4), and magenta (B3) triangles and stars, respectively. Clusters close to the A2/B3 SMS+Cluster models within the 2 × photometric error + reddening limit are shown in the magenta box. The reddening vector is shown in the top right corner of the plot. The length of the reddening vector corresponds to E(B − V) = 0.2 with the Milky Way extinction law (Cardelli et al. 1989). All the magnitudes and colors are given in the AB magnitude system.
Current usage metrics show cumulative count of Article Views (full-text article views including HTML views, PDF and ePub downloads, according to the available data) and Abstracts Views on Vision4Press platform.
Data correspond to usage on the plateform after 2015. The current usage metrics is available 48-96 hours after online publication and is updated daily on week days.
Initial download of the metrics may take a while.