Fig. 2.
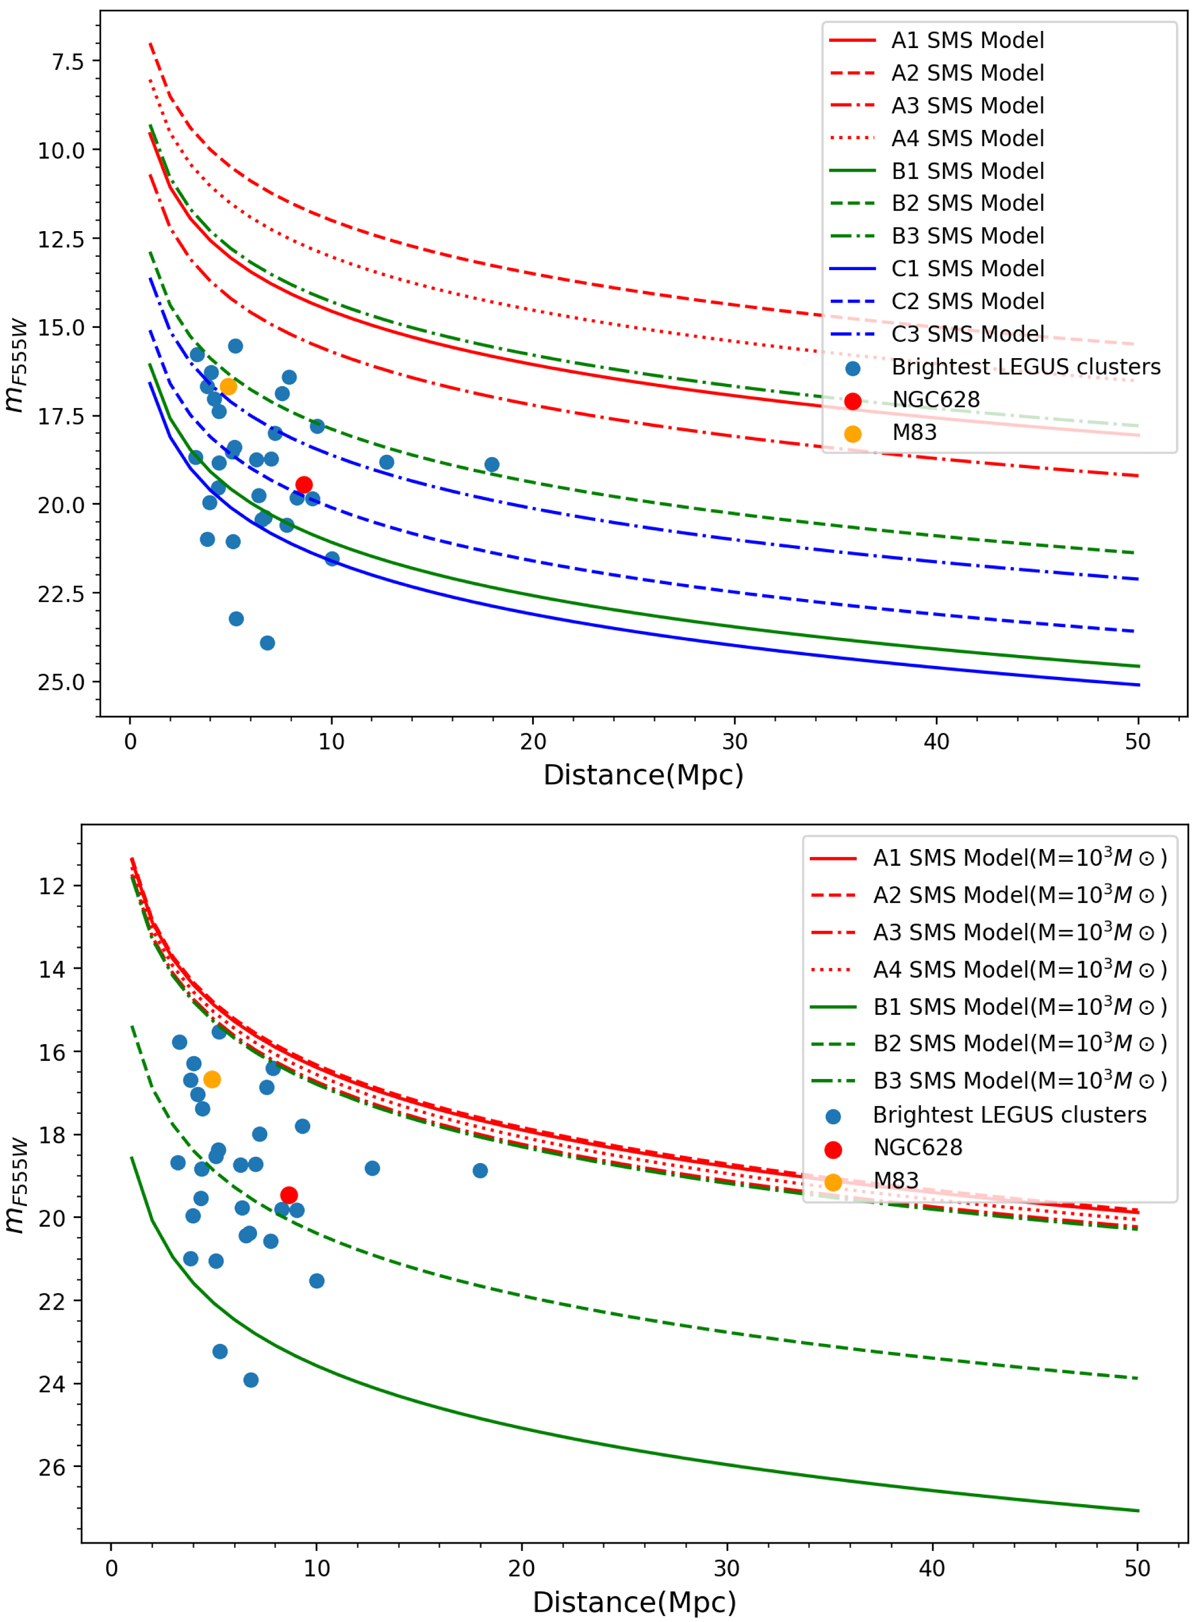
Download original image
F555W band magnitude vs. distance. Top: SMS models in (Martins et al. 2020). A series of SMS models are shown in red, each with a different line style: solid (A1), dashed (A2), dash-dotted (A3), and dotted (A4). Similarly, B series models are shown in green: solid (B1), dashed (B2), and dash-dotted (B3), and C series models are shown as blue: solid (C1), dashed (C2), and dash-dotted (C3). The brightest clusters in 32 LEGUS galaxies are shown as blue filled dots. The brightest clusters in this study are indicated as red (NGC 628) and orange (M 83) filled dots. Bottom: A series and B series models are rescaled to the minimum mass of 103 M⊙. The indicators are the same as in the top figure.
Current usage metrics show cumulative count of Article Views (full-text article views including HTML views, PDF and ePub downloads, according to the available data) and Abstracts Views on Vision4Press platform.
Data correspond to usage on the plateform after 2015. The current usage metrics is available 48-96 hours after online publication and is updated daily on week days.
Initial download of the metrics may take a while.