Fig. 10.
Download original image
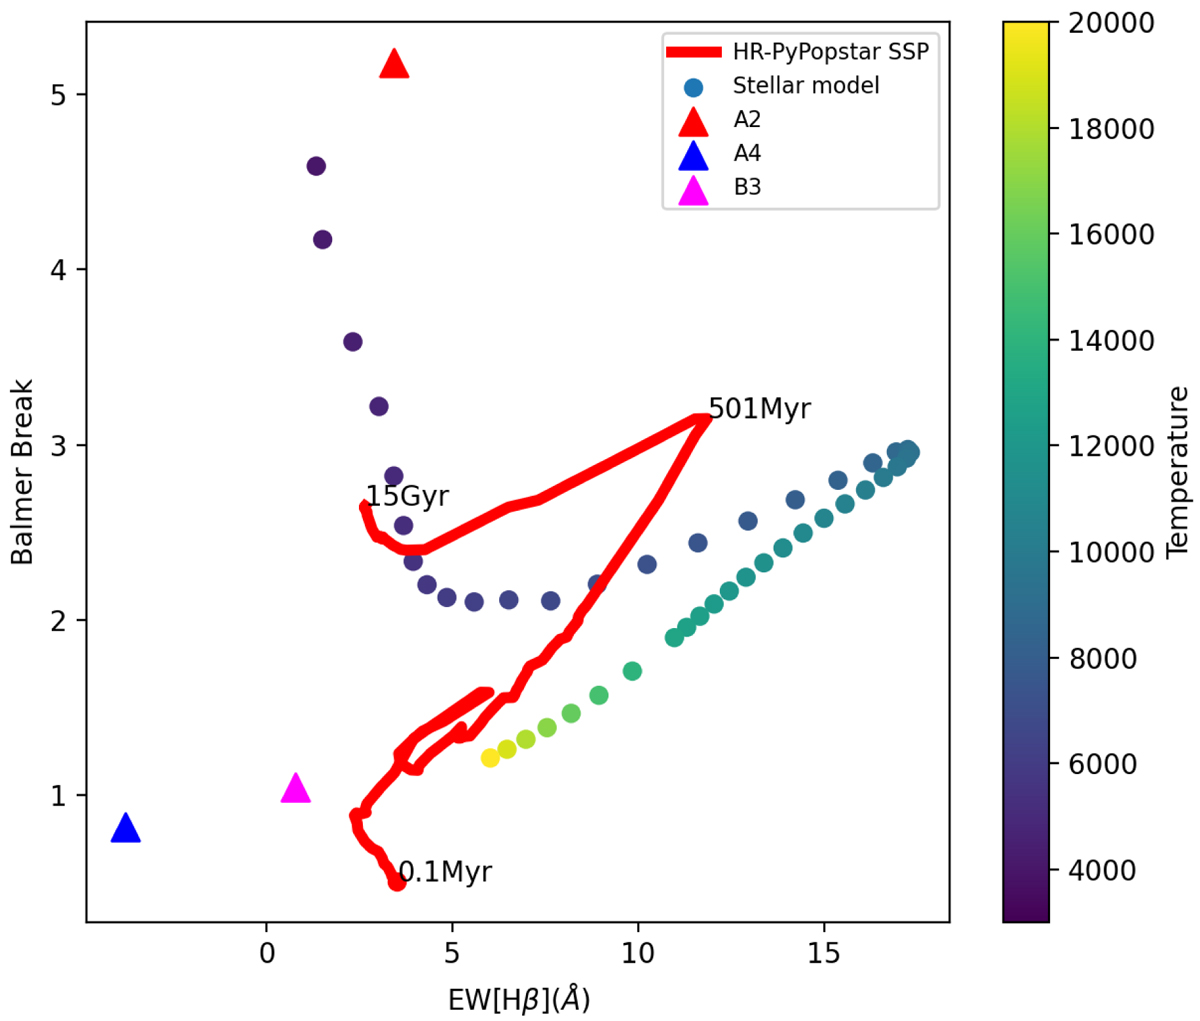
Predicted stellar Hβ absorption line strength EW(Hβ) vs a measure of Balmer Break. The red, blue, and magenta triangles show the A2, A4, and B3 SMS models, respectively. The SSP models with an age range of 0.1 Myr–15 Gyr are shown with the red line. Models of individual main sequence stars with log g = 4.5 and varying Teff are shown as dots color-coded according to temperature.
Current usage metrics show cumulative count of Article Views (full-text article views including HTML views, PDF and ePub downloads, according to the available data) and Abstracts Views on Vision4Press platform.
Data correspond to usage on the plateform after 2015. The current usage metrics is available 48-96 hours after online publication and is updated daily on week days.
Initial download of the metrics may take a while.