Fig. 1.
Download original image
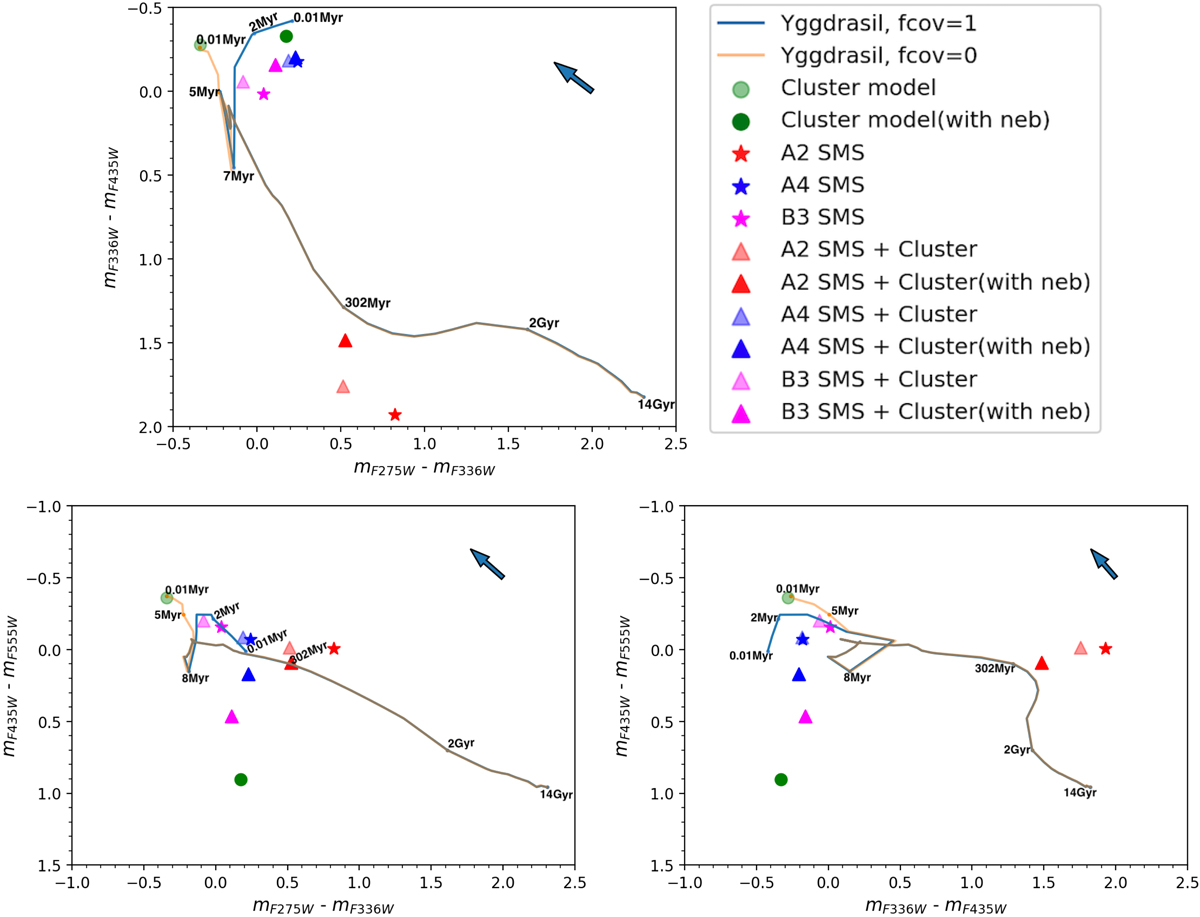
Theoretical color–color diagrams showing the effect of SMS hosted in young clusters compared to normal SSPs. Top: mF336W − mF435W vs. mF275W − mF336W color–color diagram. Bottom left: mF435 − mF555W vs. mF275W − mF336W color–color diagram. Bottom right: mF435W − mF555W vs. mF336W − mF435W color–color diagram. Yggdrasil models with solar metallicity and different covering factors are shown as blue (fcov = 1) and yellow (fcov = 0) lines. After 10 Myr, the fcov is not relevant because the cluster is expected to be gas free. Therefore, models with different fcov produce the same color indices and are therefore seen as a single brown line. The young cluster model from Martins et al. (2020) is shown as a large green dot. Different SMS+Cluster and SMS models are shown in red (A2), blue (A4), and magenta (B3) triangles and stars, respectively. For the cluster and cluster+SMS models, the transparent symbols are models without including the nebular emission while the dark ones are with nebular emission. The arrow in the top right corner shows the reddening vector. The length of the reddening vector corresponds to E(B − V) = 0.2 with the Milky Way extinction law (Cardelli et al. 1989). All magnitudes and colors are given in the AB magnitude system.
Current usage metrics show cumulative count of Article Views (full-text article views including HTML views, PDF and ePub downloads, according to the available data) and Abstracts Views on Vision4Press platform.
Data correspond to usage on the plateform after 2015. The current usage metrics is available 48-96 hours after online publication and is updated daily on week days.
Initial download of the metrics may take a while.