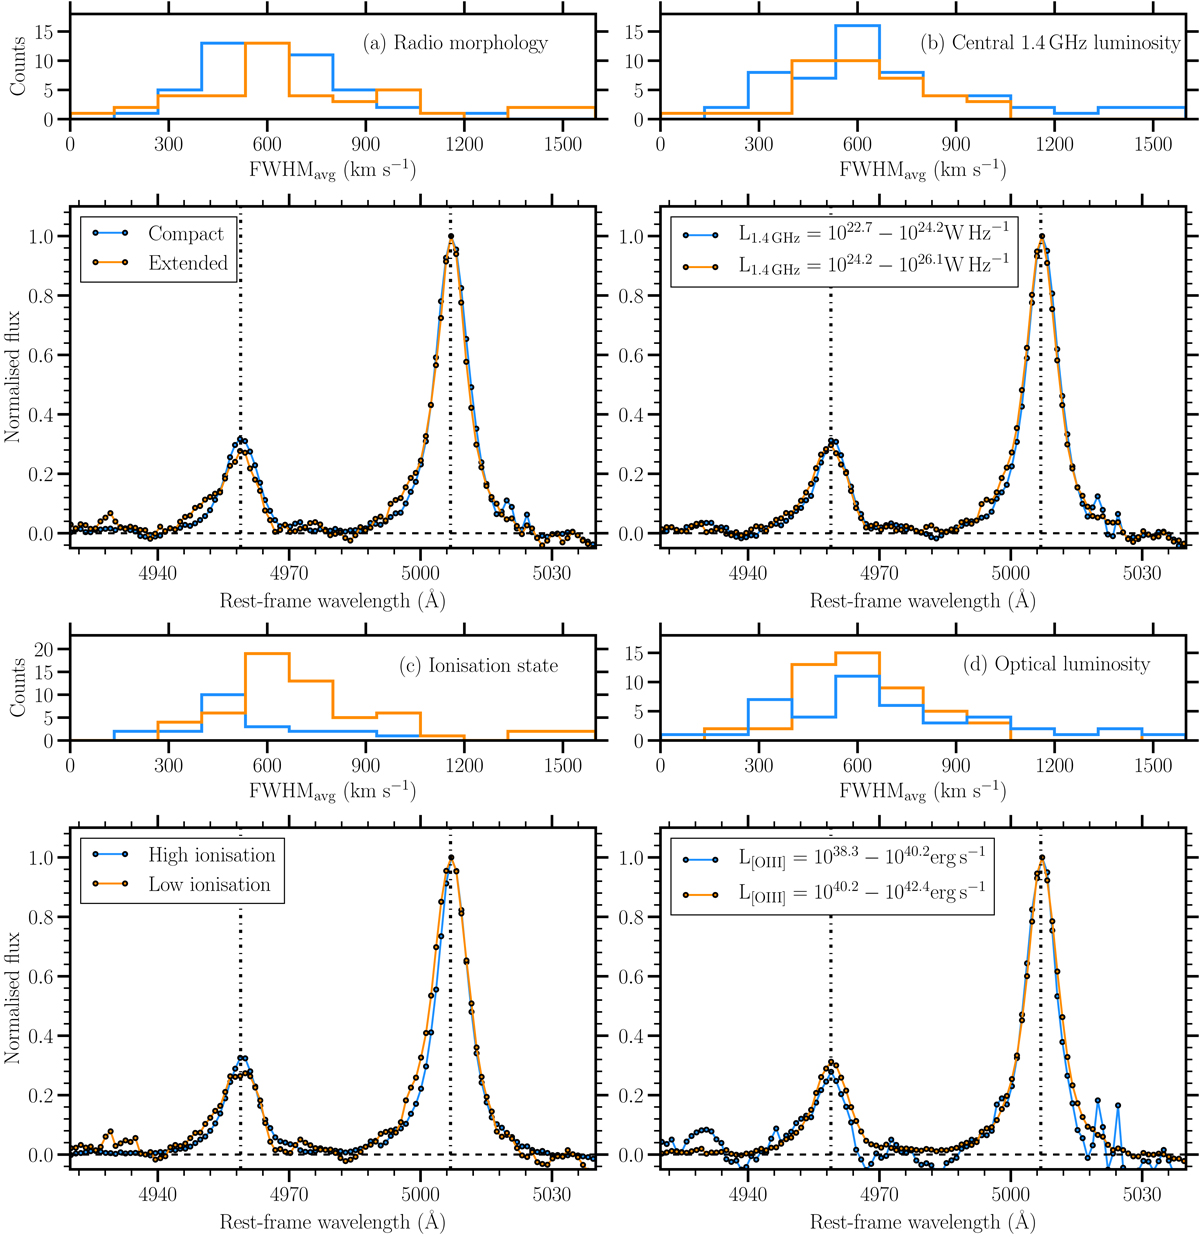
Fig. 7.
Download original image
Stacked [O III] spectra and FWHMavg distributions for groups based on (a) radio morphology, (b) central 1.4 GHz luminosity, (c) BPT diagram and (d) optical luminosity. The top panel in each sub figure shows the distribution of the [O III] detections in the groups. Bottom panel in the sub figures shows the stacked [O III] spectra (including non-detections). The fluxes have been normalised to the maximum value for easier comparison of the profile shapes. We only see a significant difference in the stacked spectra based on BPT classification (c).
Current usage metrics show cumulative count of Article Views (full-text article views including HTML views, PDF and ePub downloads, according to the available data) and Abstracts Views on Vision4Press platform.
Data correspond to usage on the plateform after 2015. The current usage metrics is available 48-96 hours after online publication and is updated daily on week days.
Initial download of the metrics may take a while.