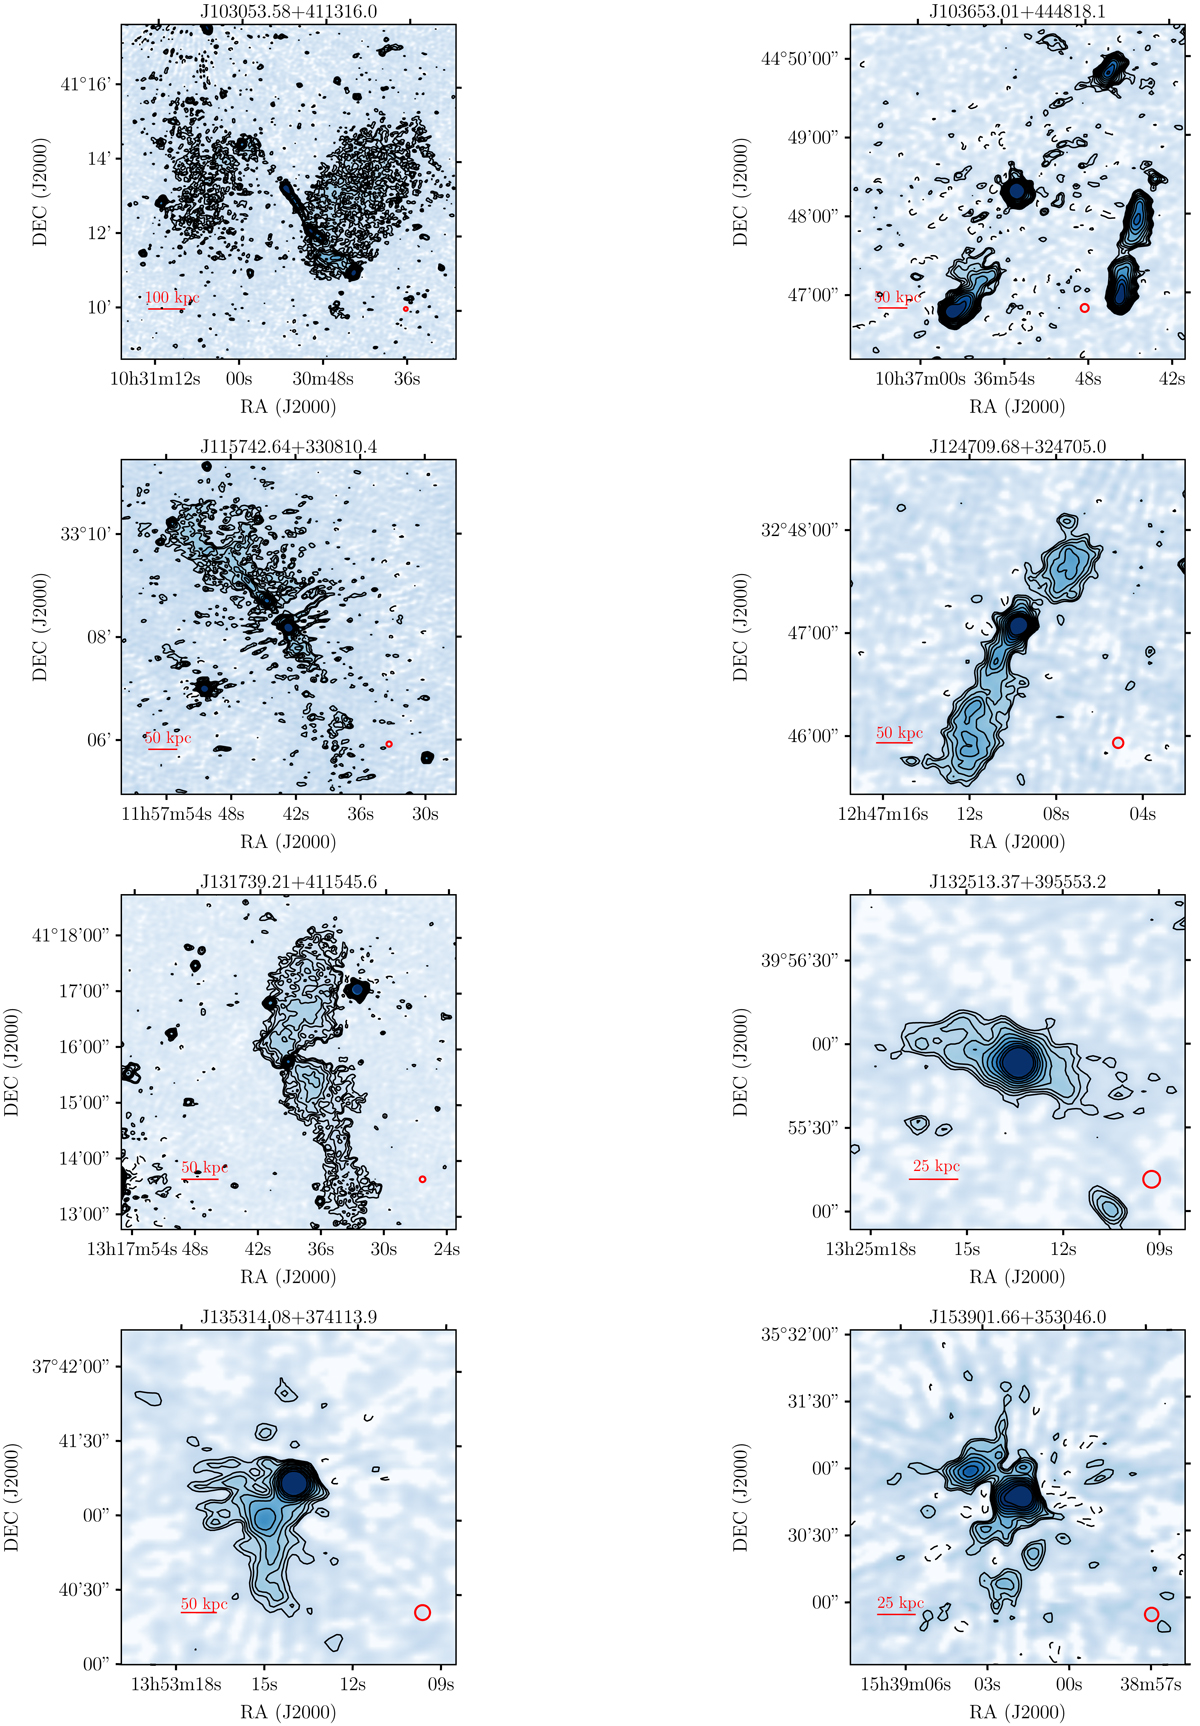
Fig. A.1.
Download original image
LoTSS continuum images of eight sources that were classified are compact in their FIRST images, but show clear signs of extended emission at 144 MHz. The contour levels in all images are 3![]() where n = 0, 1, 2… and σRMS is the local RMS noise in the images. The negative contours are marked by dashed lines and are at −3σRMS level. All of these sources (except J103653.01+444818.1) have a peaked source in the centre and are classified as candidate restarted sources.
where n = 0, 1, 2… and σRMS is the local RMS noise in the images. The negative contours are marked by dashed lines and are at −3σRMS level. All of these sources (except J103653.01+444818.1) have a peaked source in the centre and are classified as candidate restarted sources.
Current usage metrics show cumulative count of Article Views (full-text article views including HTML views, PDF and ePub downloads, according to the available data) and Abstracts Views on Vision4Press platform.
Data correspond to usage on the plateform after 2015. The current usage metrics is available 48-96 hours after online publication and is updated daily on week days.
Initial download of the metrics may take a while.