Fig. 9
Download original image
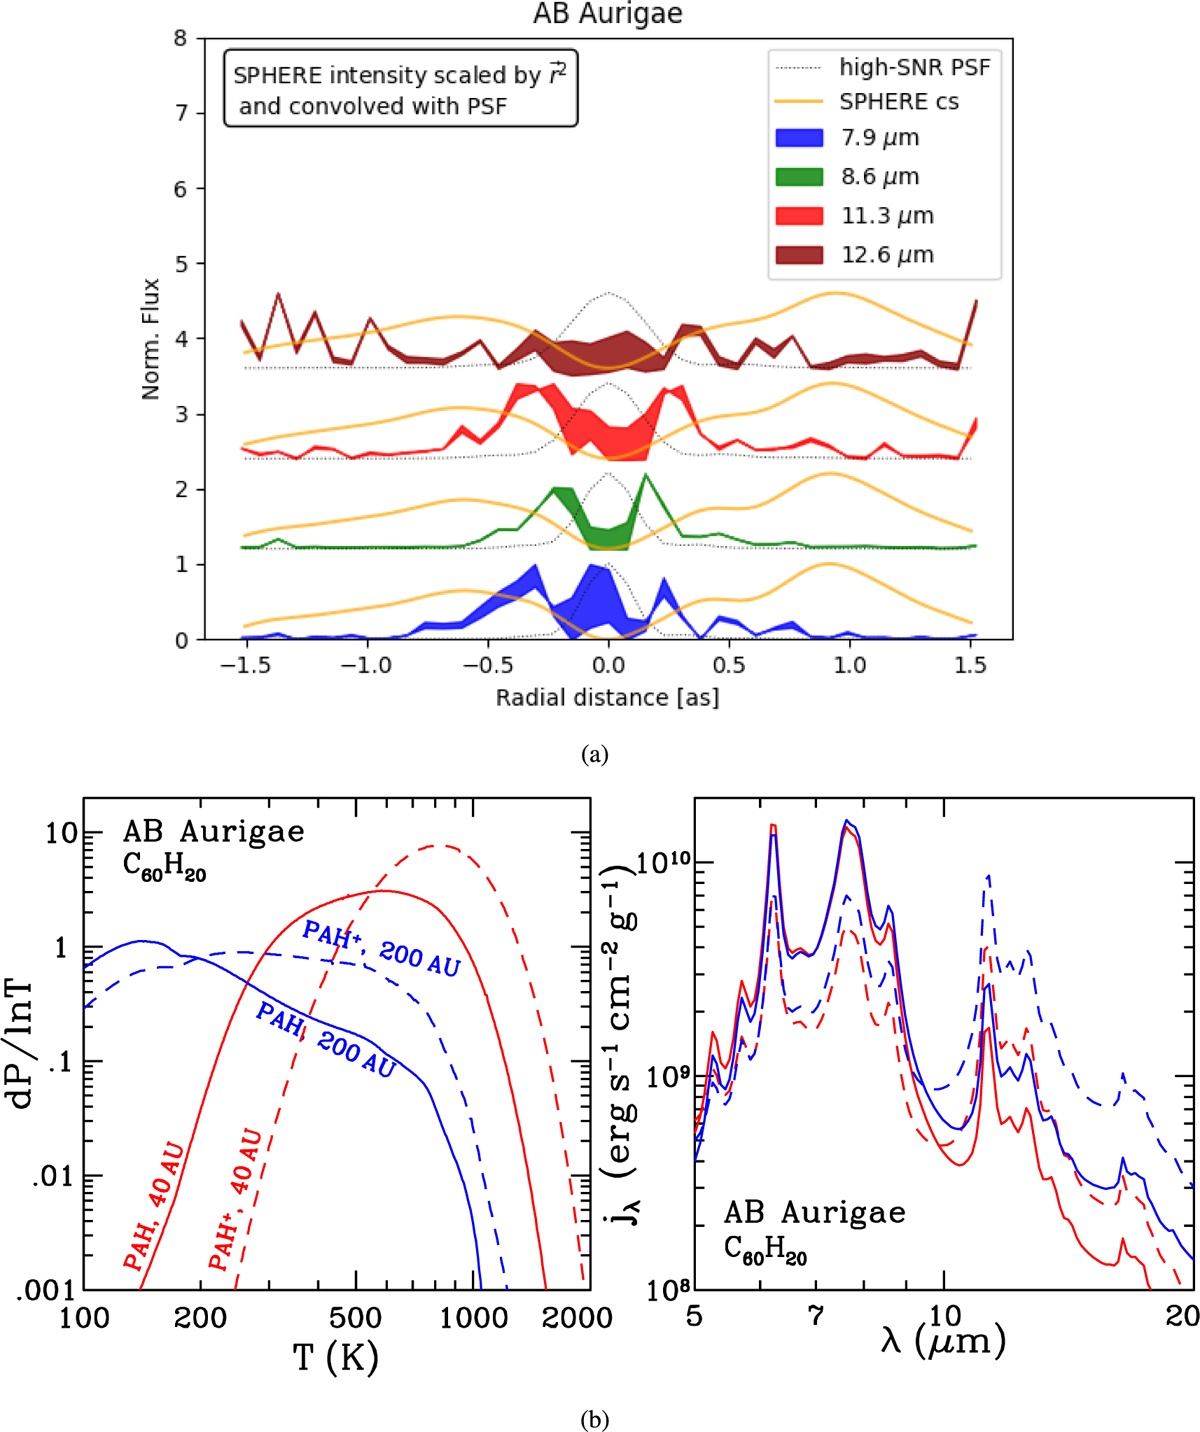
PAH intensity profiles and model calculations for AB Aurigae. Panel a: Comparison of the normalized radial profiles of the three prominent PAH bands (7.9 μm, 8.6 μm and 11.3 μm, and 12.6 μm, from bottom to top, respectively) with a radial intensity profile of the reduced SPHERE image (Fig. 2). Panel b: Temperature probability distributions (left panel) and emission spectra (right panel) of neutral C60H20 (solid lines; labeled "PAH") and its cation (dashed lines; labeled "PAH+") for two nominal distances: 0."228, which corresponds to ≈40AU from the central star (red lines), and 1."14, which corresponds to «200AU from the central star (blue lines), respectively, in the innermost and outermost disk regions probed by VISIR-NEAR. The temperature probability distribution functions for C60H20 and ![]() are broad even for the innermost disk region, indicating that PAHs undergo stochastic heating by individual stellar photons even in the innermost disk region, where the photon absorption rate is ~25 times more frequent compared to that in the outermost disk region. The stochastic-heating nature of PAHs in the disk around AB Aurigae is also indicated by the close resemblance of the model emission spectra calculated for C60H20 and
are broad even for the innermost disk region, indicating that PAHs undergo stochastic heating by individual stellar photons even in the innermost disk region, where the photon absorption rate is ~25 times more frequent compared to that in the outermost disk region. The stochastic-heating nature of PAHs in the disk around AB Aurigae is also indicated by the close resemblance of the model emission spectra calculated for C60H20 and ![]() at 40AU (solid and dashed red lines) to that at 200AU, when scaled to the same radial distance, (solid and dashed blue lines).
at 40AU (solid and dashed red lines) to that at 200AU, when scaled to the same radial distance, (solid and dashed blue lines).
Current usage metrics show cumulative count of Article Views (full-text article views including HTML views, PDF and ePub downloads, according to the available data) and Abstracts Views on Vision4Press platform.
Data correspond to usage on the plateform after 2015. The current usage metrics is available 48-96 hours after online publication and is updated daily on week days.
Initial download of the metrics may take a while.