Fig. 8
Download original image
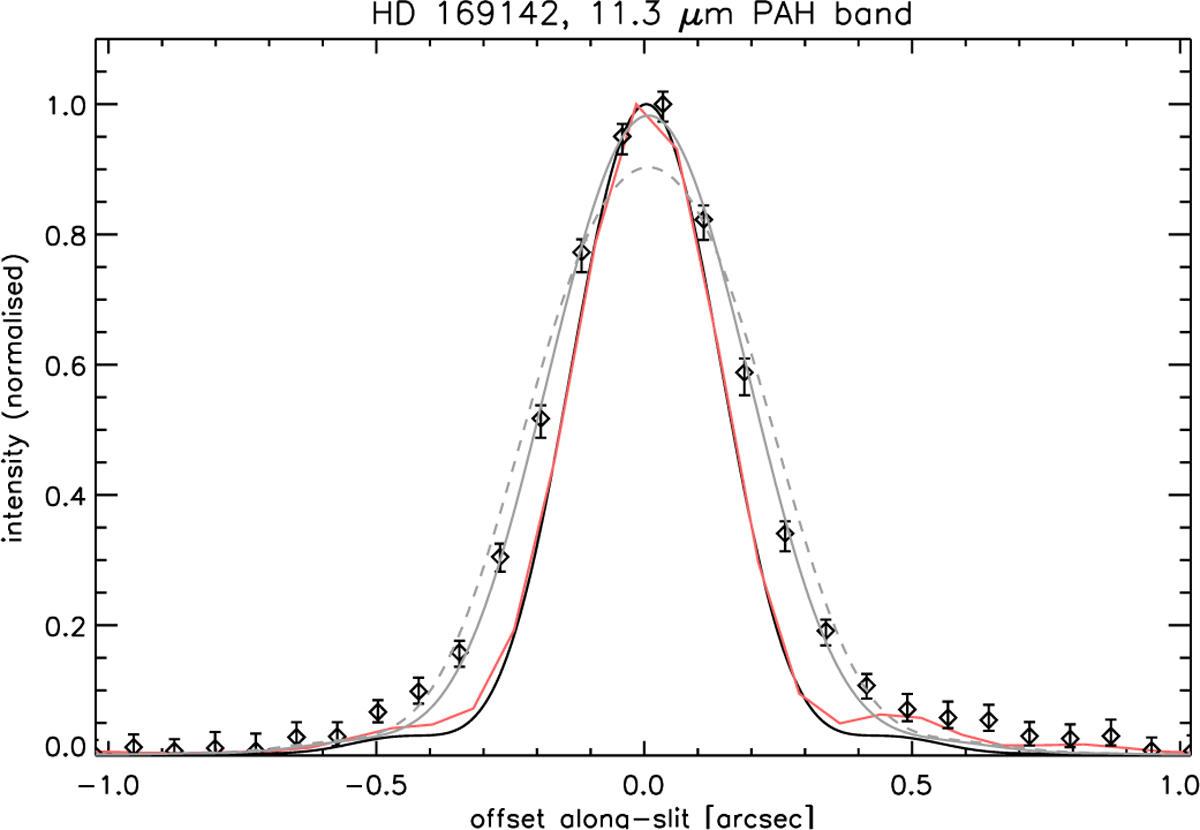
Spatial emission profile of HD 169142 in the 11.3 μm PAH band. The red curve shows the observed PSF profile (see Appendix F), and the black curve shows the employed approximation thereof used in the 2D convolution of the model (see Sect. 5.2.5). The solid gray curve shows the ring model that best fits the observed central peak (ring radius 0."14). The dashed gray curve shows the best-fit model with the ring radius fixed to the value observed in the SPHERE data (0."17).
Current usage metrics show cumulative count of Article Views (full-text article views including HTML views, PDF and ePub downloads, according to the available data) and Abstracts Views on Vision4Press platform.
Data correspond to usage on the plateform after 2015. The current usage metrics is available 48-96 hours after online publication and is updated daily on week days.
Initial download of the metrics may take a while.