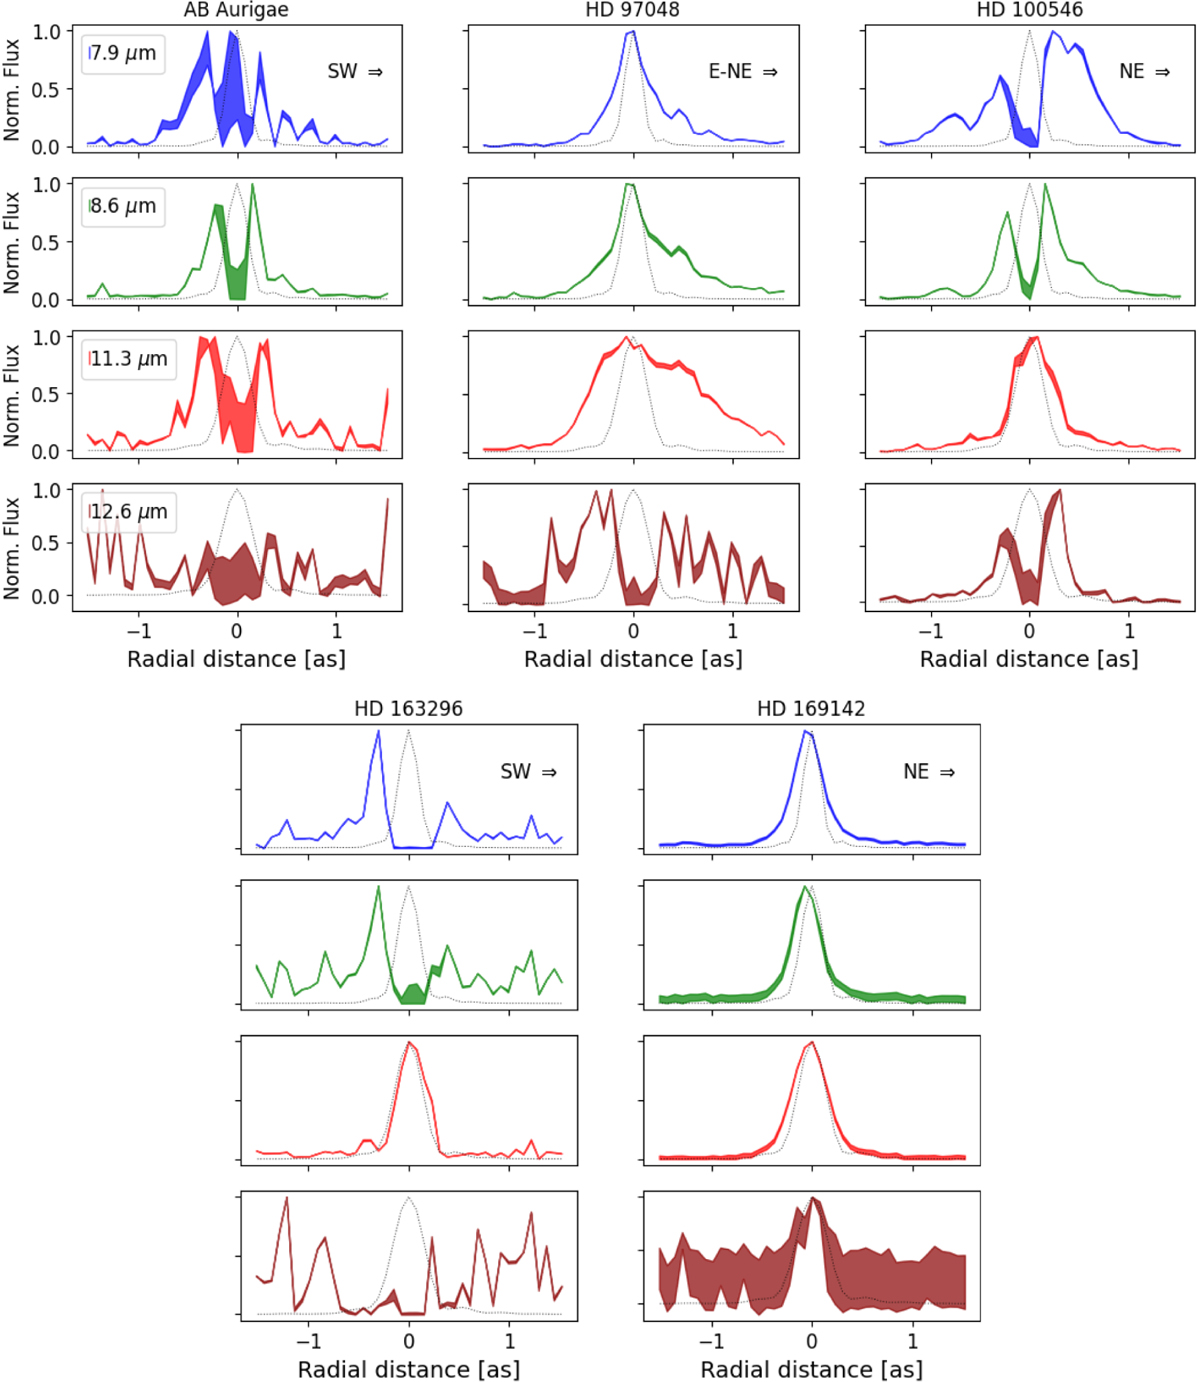
Fig. 7
Download original image
Radial profile of the normalized PAH emission in four spectral bands for select sources. Sources are ordered column-wise, and the PAH bands are ordered row-wise and are color-coded (from 7.9 μm in the uppermost row to 12.6 μm in the bottom row). The filled area represents the ±1σ error range around the median value of the emission amplitude posterior distribution of the relevant PAH template (see Appendix C). The orientation of the spatial dimension (parallel to the long axis of the slit) is denoted in the upper-right corner of the uppermost panel. Additionally, the dashed gray line is the high-S/N synthesized PSF (Appendix F), plotted for reference.
Current usage metrics show cumulative count of Article Views (full-text article views including HTML views, PDF and ePub downloads, according to the available data) and Abstracts Views on Vision4Press platform.
Data correspond to usage on the plateform after 2015. The current usage metrics is available 48-96 hours after online publication and is updated daily on week days.
Initial download of the metrics may take a while.