Fig. 6
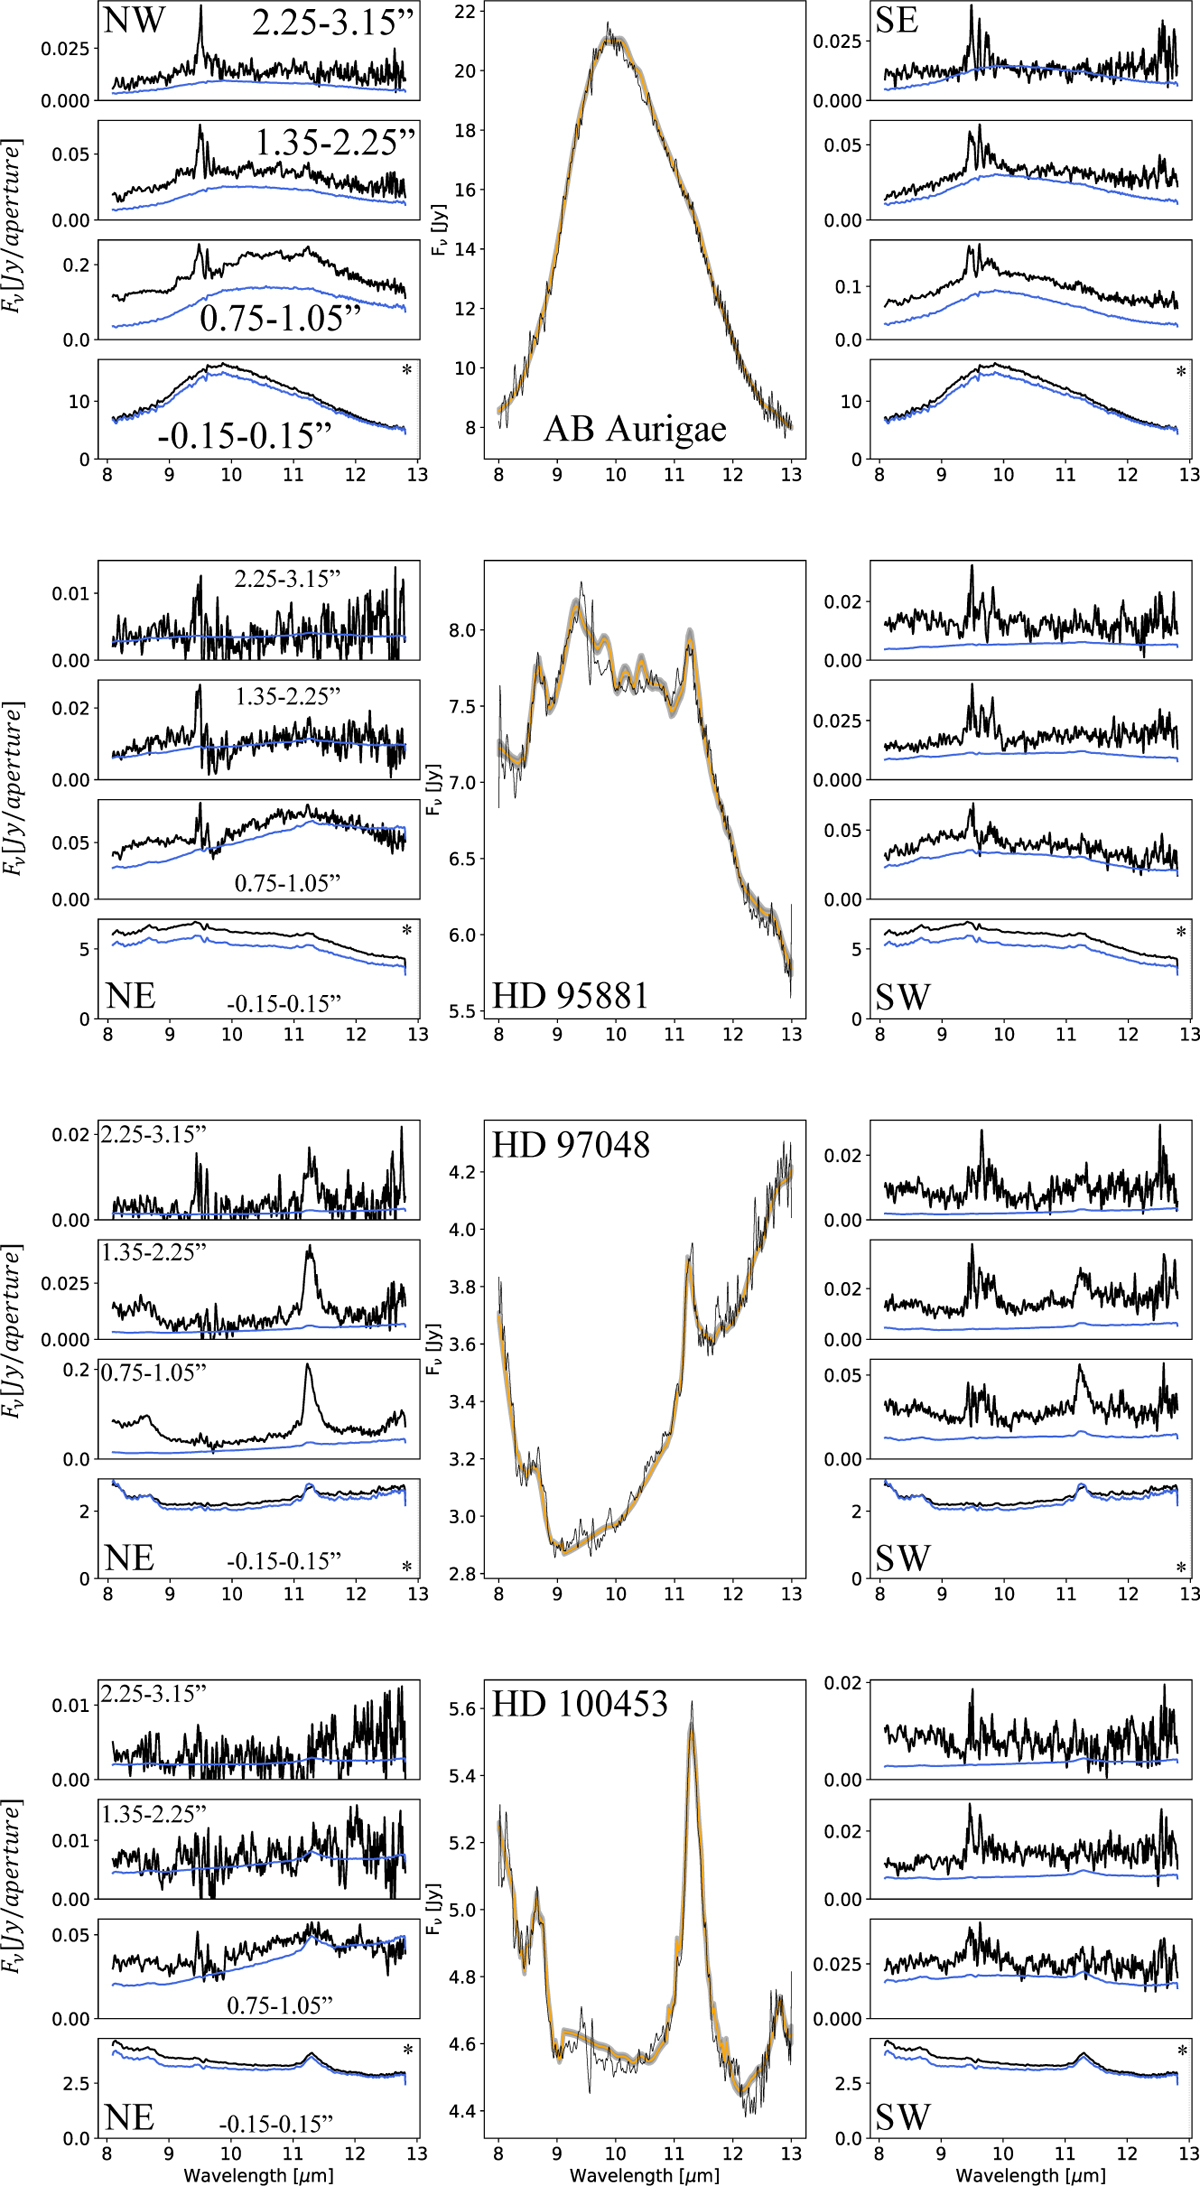
Download original image
Calibrated long-slit spectra of our targets. Left panel: Spatially resolved spectra. The black curves are down-slit spatially resolved spectra. Each spectrum represents an average of a ≈ λ/D-wide spectral bin (every three rows of the reduced 2D spectrum, whose centroids are separated by 0″.228 and are arranged bottom up, where the bottom spectrum is that of the central object). The uppermost spectrum, farthest from the star, is averaged over three such apertures. The blue curves are the expected flux contamination coming from the unresolved central source, extracted as described in Sect. 5.1. The off-axis direction is indicated by the two letters in the top or bottom panels (e.g., NE for northeast). Middle panel: Fitted integrated spectra. The solid black line is the observed spectrum, the thicker orange line is the best-fit spectrum, and the filled gray area is the ±1σ error-range, where σ is the flux-wise standard deviation of spectra generated with all best-fit parameters within the 50 ± 34 percentiles range. Right panel: Similar to the left panel, but on the opposite side of the star with respect to the slit axis. Note that spectra marked with an asterisk are identical in both the left and right panels. Note also that the spectral artifact visible at ≈9.6 μu is caused by the atmospheric ozone absorption band. Continued on the next page.
Current usage metrics show cumulative count of Article Views (full-text article views including HTML views, PDF and ePub downloads, according to the available data) and Abstracts Views on Vision4Press platform.
Data correspond to usage on the plateform after 2015. The current usage metrics is available 48-96 hours after online publication and is updated daily on week days.
Initial download of the metrics may take a while.