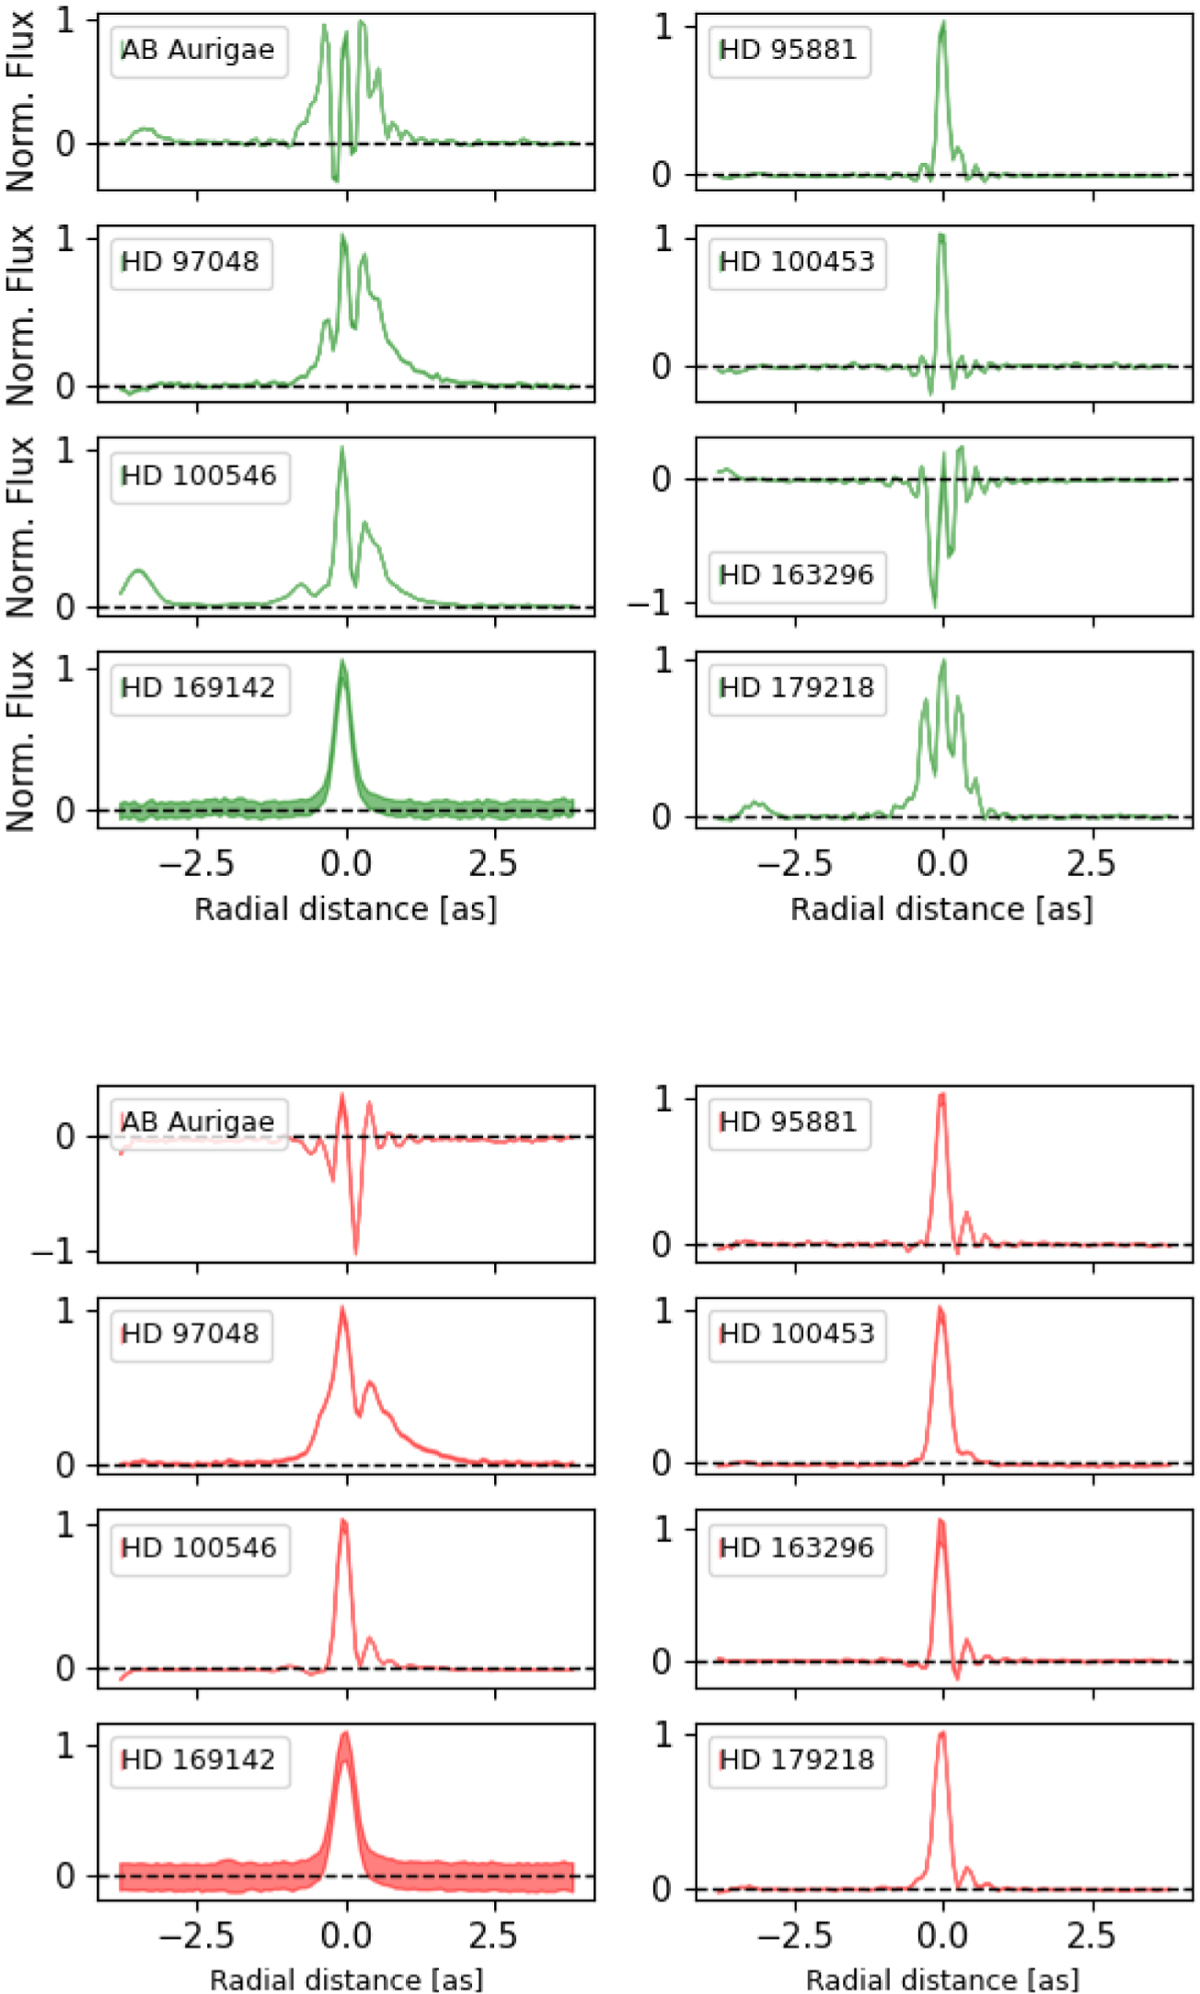
Fig. 5
Download original image
Normalized flux excess in the 8.6 μm and 11.3 μm PAH bands (top and bottom panels, respectively). The width of the lines represents the ±1σ residuals of the PAH and continuum windows (see Sect. 4.1). The x-axis is parallel to the slit (i.e., its spatial dimension), and the zero point is the object's center (the star). Note that negative values indicate that the flux in the continuum windows is greater than that in the PAH window. This is caused by silicate emission in the continuum window.
Current usage metrics show cumulative count of Article Views (full-text article views including HTML views, PDF and ePub downloads, according to the available data) and Abstracts Views on Vision4Press platform.
Data correspond to usage on the plateform after 2015. The current usage metrics is available 48-96 hours after online publication and is updated daily on week days.
Initial download of the metrics may take a while.