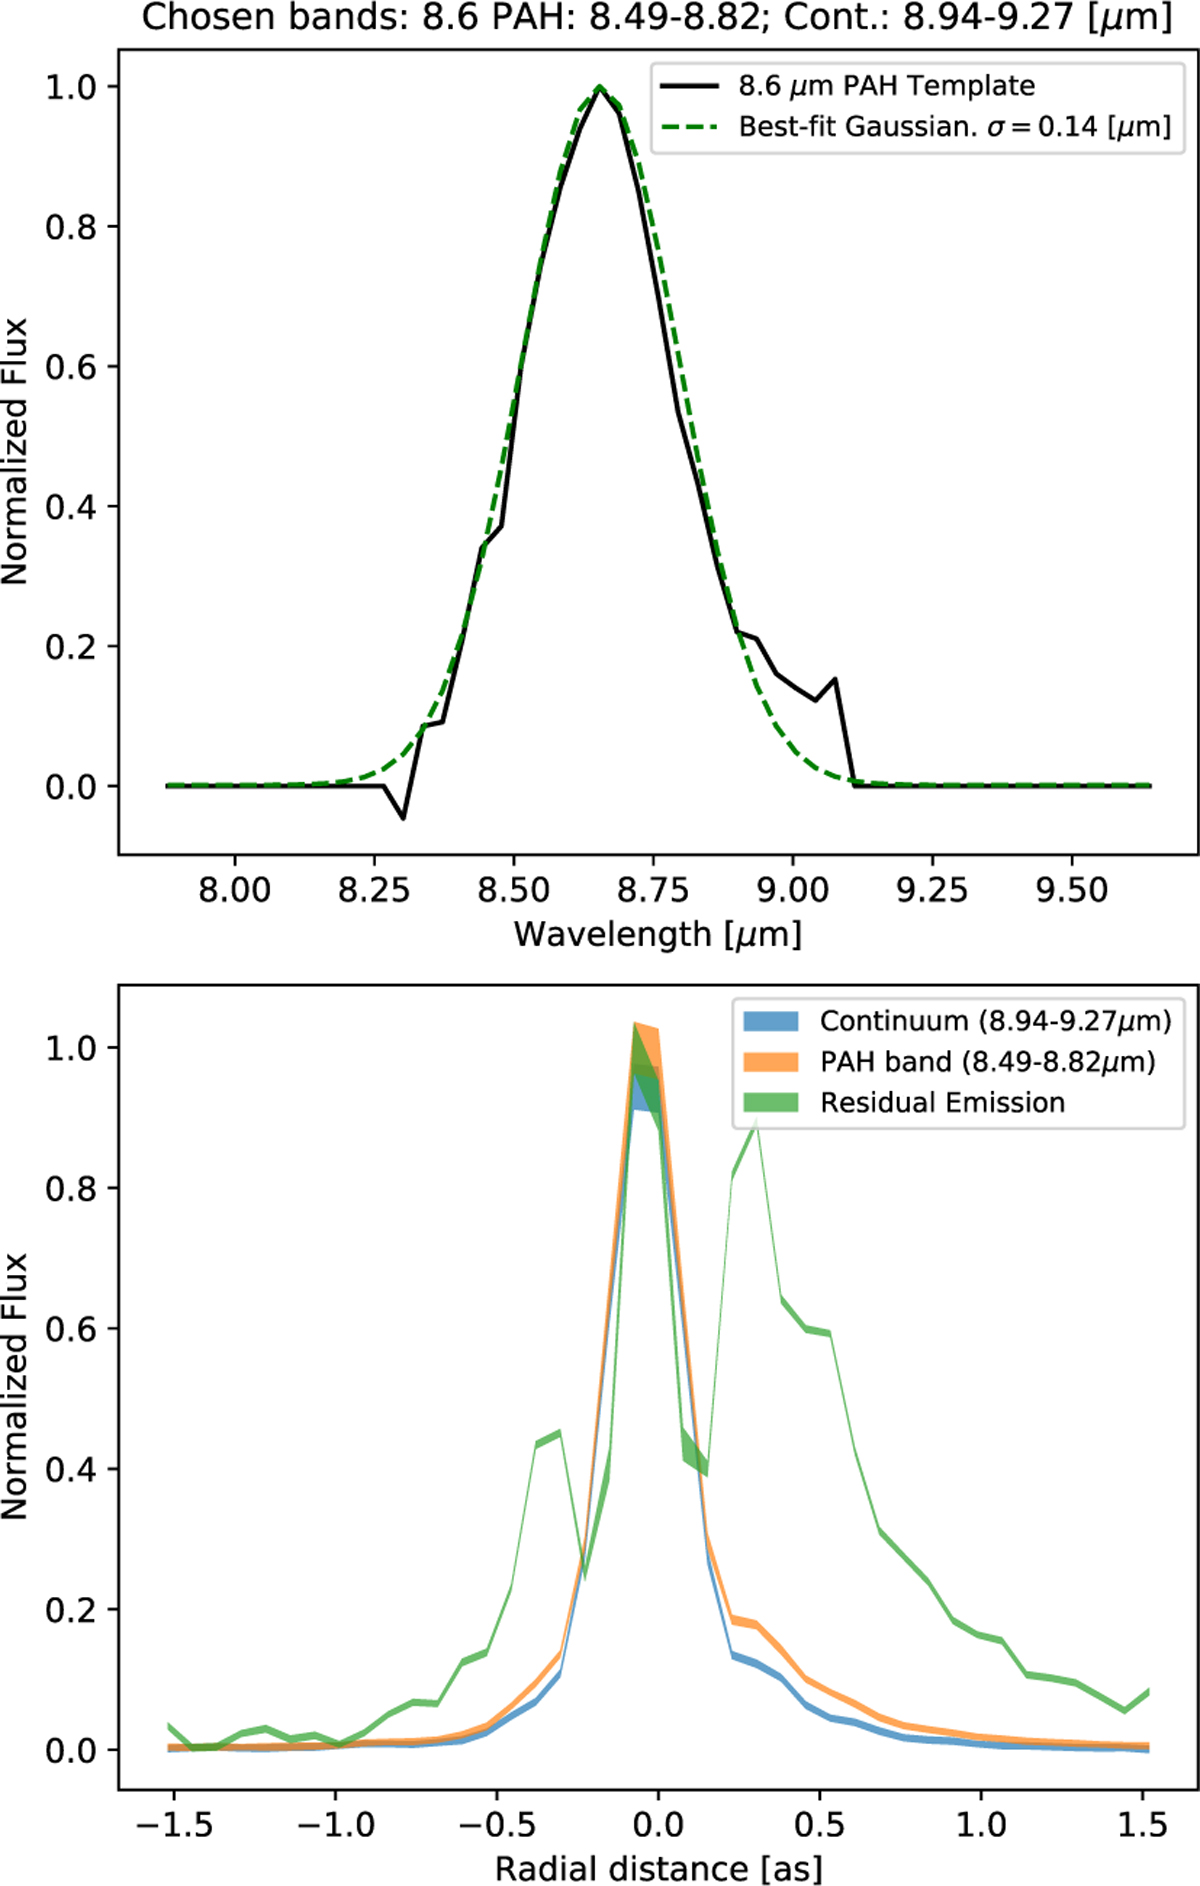
Fig. 4
Download original image
Excess flux analysis of the 8.6 μm PAH band of HD 97048. Top panel: Gaussian fitting of the 8.6 μm PAH template, with a resulting standard deviation of σtemplate ≈ 0.14 μm. The aperture of the PAH spectral window is defined as ±1.17 σtemplate, and the continuum aperture is set to be two FWHMs down the red part of the spectrum (the chosen widths for each are plotted atop the panel). Bottom panel: Fluxes integrated over the continuum and PAH apertures, and the computed excess flux (blue, orange, and green curves, respectively) and their respective ±1σ uncertainties (see Appendix C), indicated by curve widths.
Current usage metrics show cumulative count of Article Views (full-text article views including HTML views, PDF and ePub downloads, according to the available data) and Abstracts Views on Vision4Press platform.
Data correspond to usage on the plateform after 2015. The current usage metrics is available 48-96 hours after online publication and is updated daily on week days.
Initial download of the metrics may take a while.