Fig. 3
Download original image
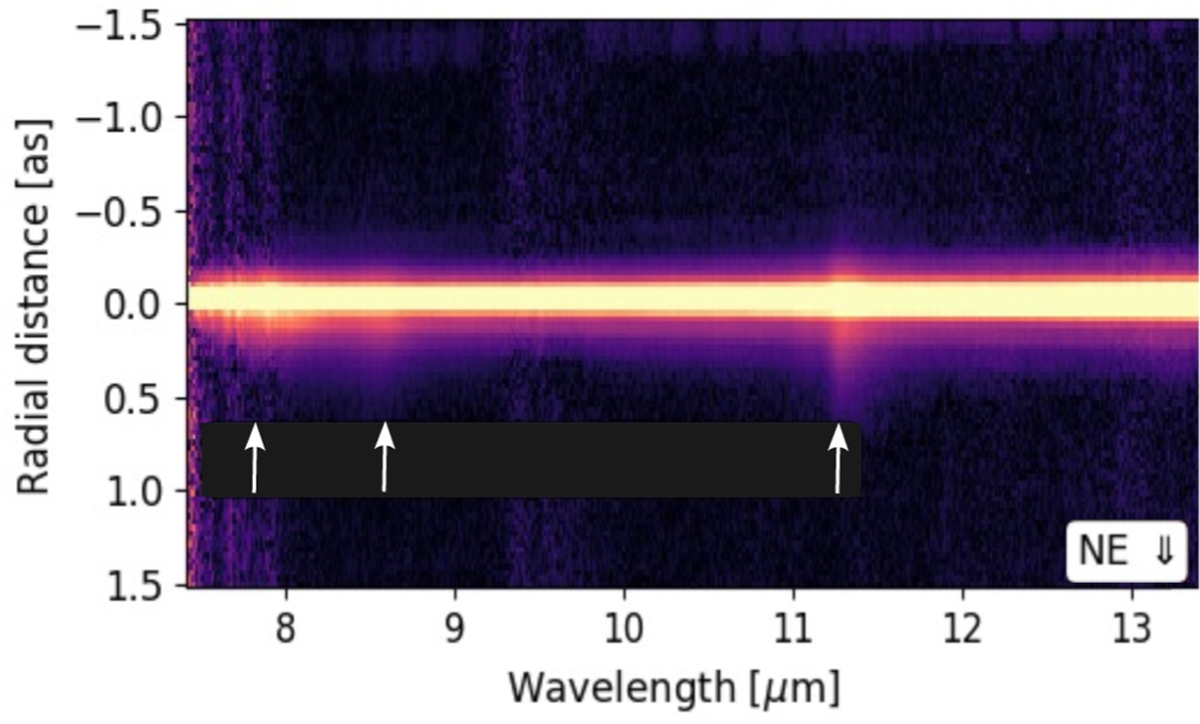
Calibrated 2D spectrum of HD 97048. The x-axis is the spectral dimension perpendicular to the long axis of the slit, and the y-axis is the spatial axis parallel thereto. The source is positioned in the center of the y-axis. Spatially resolved emission in the PAH bands is highlighted with white arrows. Note the image was square-root-stretched for demonstration purposes.
Current usage metrics show cumulative count of Article Views (full-text article views including HTML views, PDF and ePub downloads, according to the available data) and Abstracts Views on Vision4Press platform.
Data correspond to usage on the plateform after 2015. The current usage metrics is available 48-96 hours after online publication and is updated daily on week days.
Initial download of the metrics may take a while.