Fig. 1
Download original image
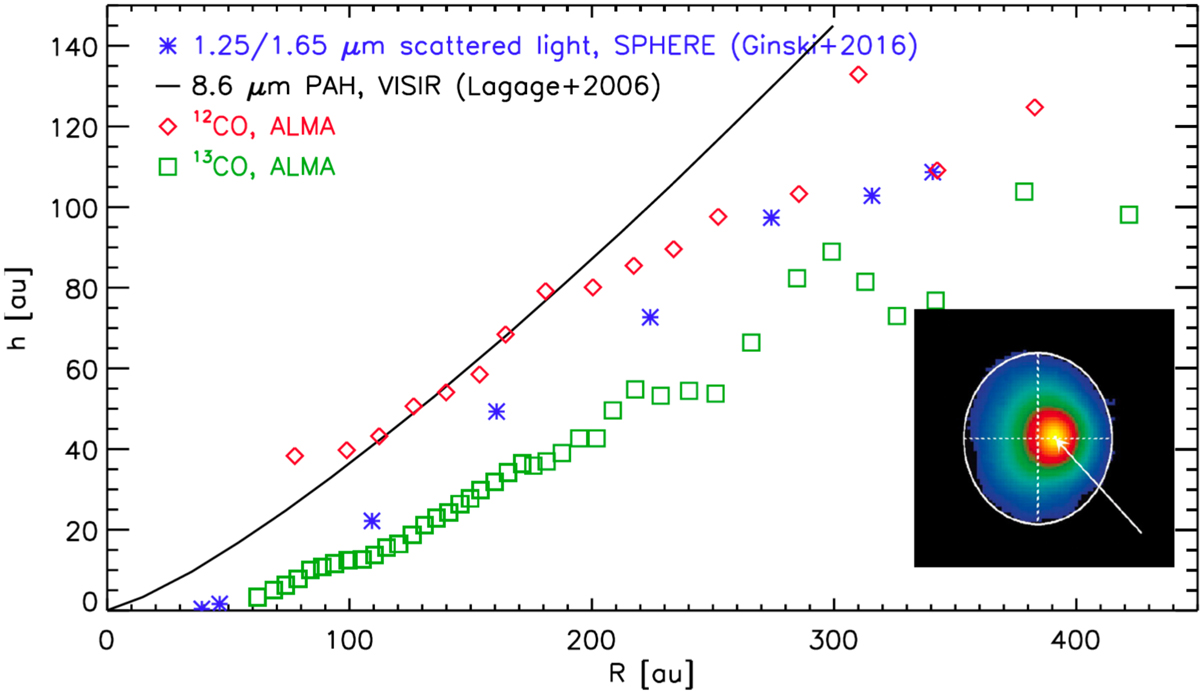
Variations in the effective emission height of different tracers for a 3D disk demonstrated for HD 97048: (1) scattered-light as observed with SPHERE (Ginski et al. 2016), (2) PAH emission as observed with VISIR (Lagage et al. 2006), and (3) 13/12CO as observed with ALMA (Walsh et al. 2016). The inset on the bottom right is Fig. 4 from Lagage et al. (2006), demonstrating the 2D spatial distribution of the 8.6 μm PAH emission intensity of HD 97048.
Current usage metrics show cumulative count of Article Views (full-text article views including HTML views, PDF and ePub downloads, according to the available data) and Abstracts Views on Vision4Press platform.
Data correspond to usage on the plateform after 2015. The current usage metrics is available 48-96 hours after online publication and is updated daily on week days.
Initial download of the metrics may take a while.