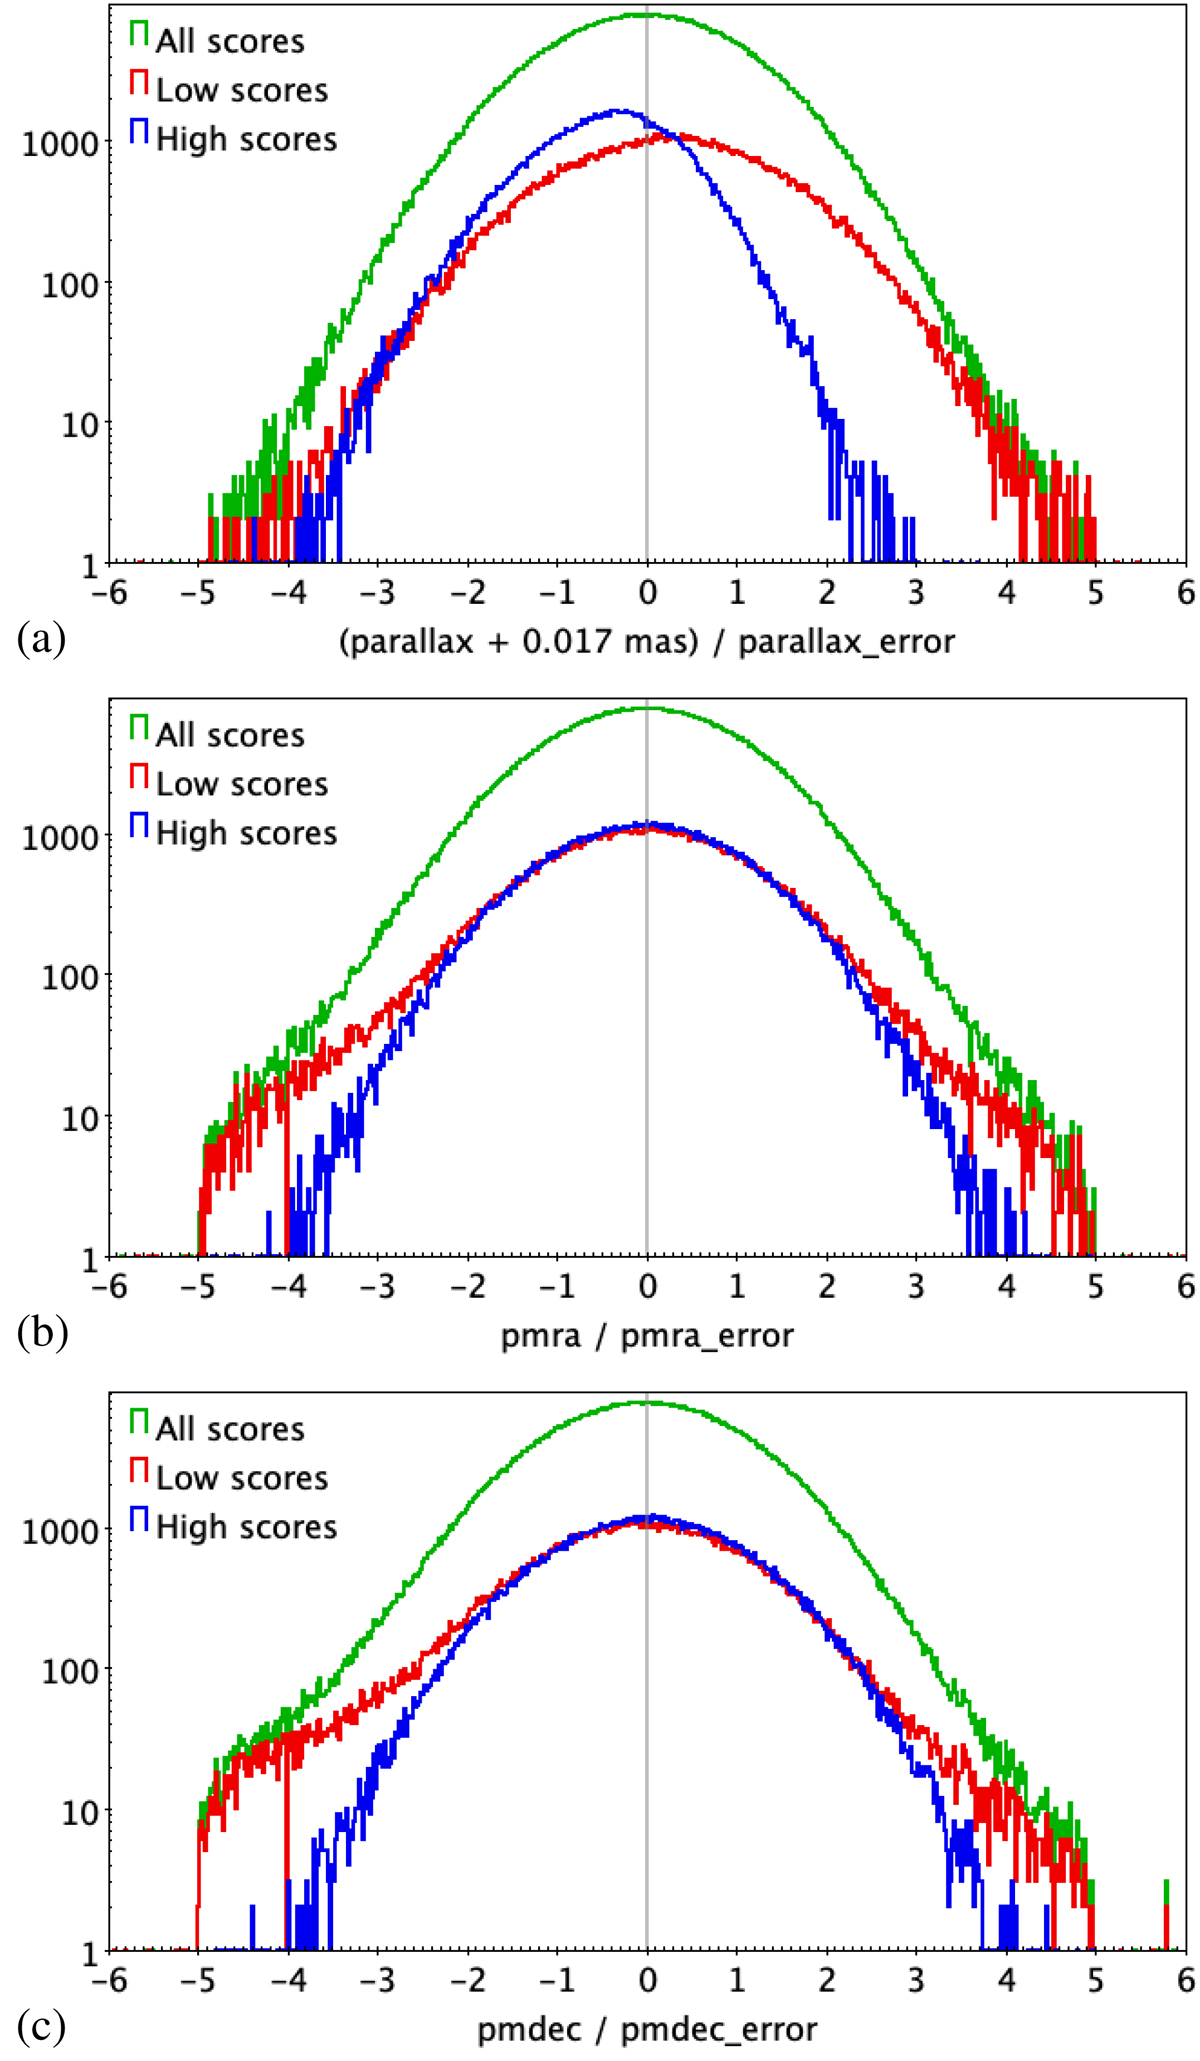
Fig. 4.
Download original image
Distribution of parallax (a) and proper motion components, pmra along the right ascension (b) and pmdec along the declination (c), normalised by the corresponding uncertainties and binned in intervals of 0.02, for the 1 034 925 AGN candidates with at least five-parameter astrometric solutions, for the top-150 000 candidates (denoted as high scores; best_class_score > 0.8995154), and for the bottom-150 000 candidates (denoted as low scores; best_class_score < 0.1615997), colour-coded as indicated in the legend. The bias from the inclusion of parallax among classification attributes is evident in panel a (see Sect. 4.3 for details).
Current usage metrics show cumulative count of Article Views (full-text article views including HTML views, PDF and ePub downloads, according to the available data) and Abstracts Views on Vision4Press platform.
Data correspond to usage on the plateform after 2015. The current usage metrics is available 48-96 hours after online publication and is updated daily on week days.
Initial download of the metrics may take a while.