Fig. 2.
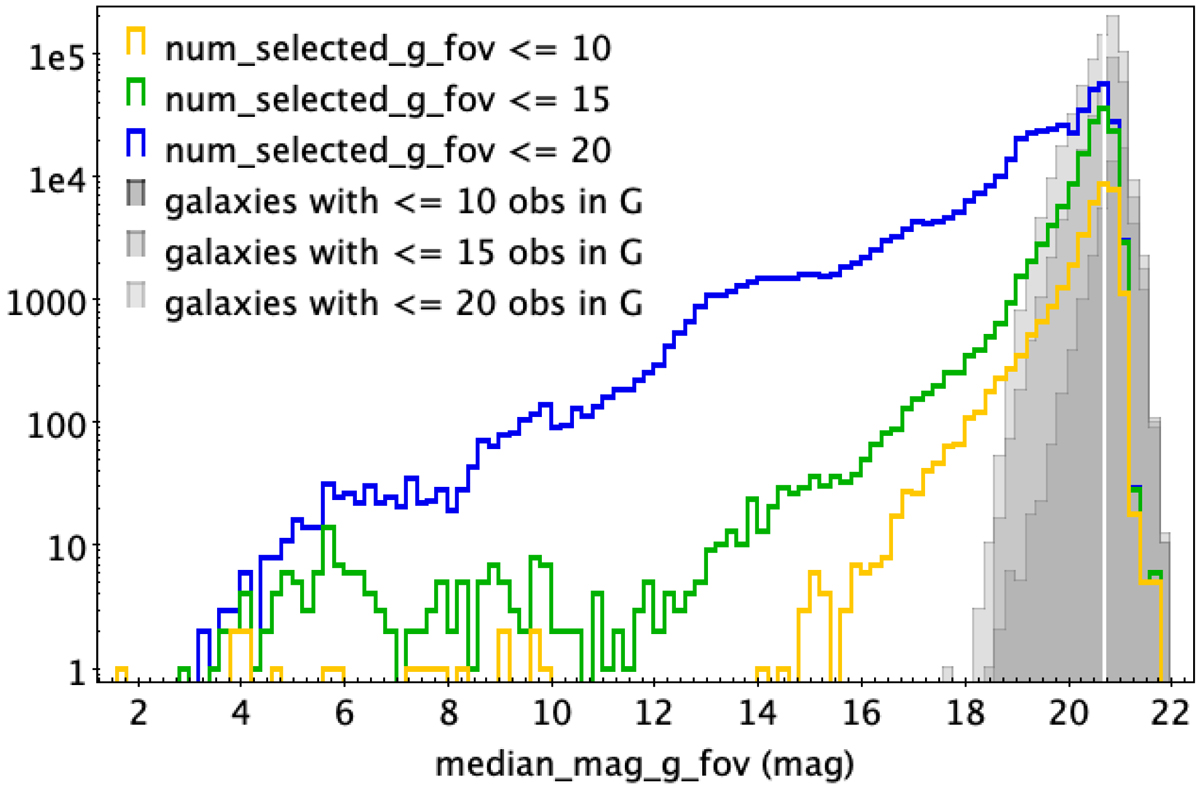
Download original image
Number of the least-sampled sources in 0.2 mag intervals as a function of the median G-band magnitude. The number of variable sources (in the vari_classifier_result table of the Gaia archive) is colour coded by the maximum number of selected FoV observations in the G band (num_selected_g_fov up to 10, 15, and 20) as shown in the legend (with orange, green, and blue colours, respectively). The bars shaded in grey refer to the same conditions but for the galaxies identified by their artificial variability (published in the galaxy_candidates table), including unpublished values of num_selected_g_fov for galaxies outside the Gaia Andromeda Photometric Survey. The white vertical line marks the median G magnitude of 20.7. The fields num_selected_g_fov and median_mag_g_fov are published in the vari_summary table.
Current usage metrics show cumulative count of Article Views (full-text article views including HTML views, PDF and ePub downloads, according to the available data) and Abstracts Views on Vision4Press platform.
Data correspond to usage on the plateform after 2015. The current usage metrics is available 48-96 hours after online publication and is updated daily on week days.
Initial download of the metrics may take a while.