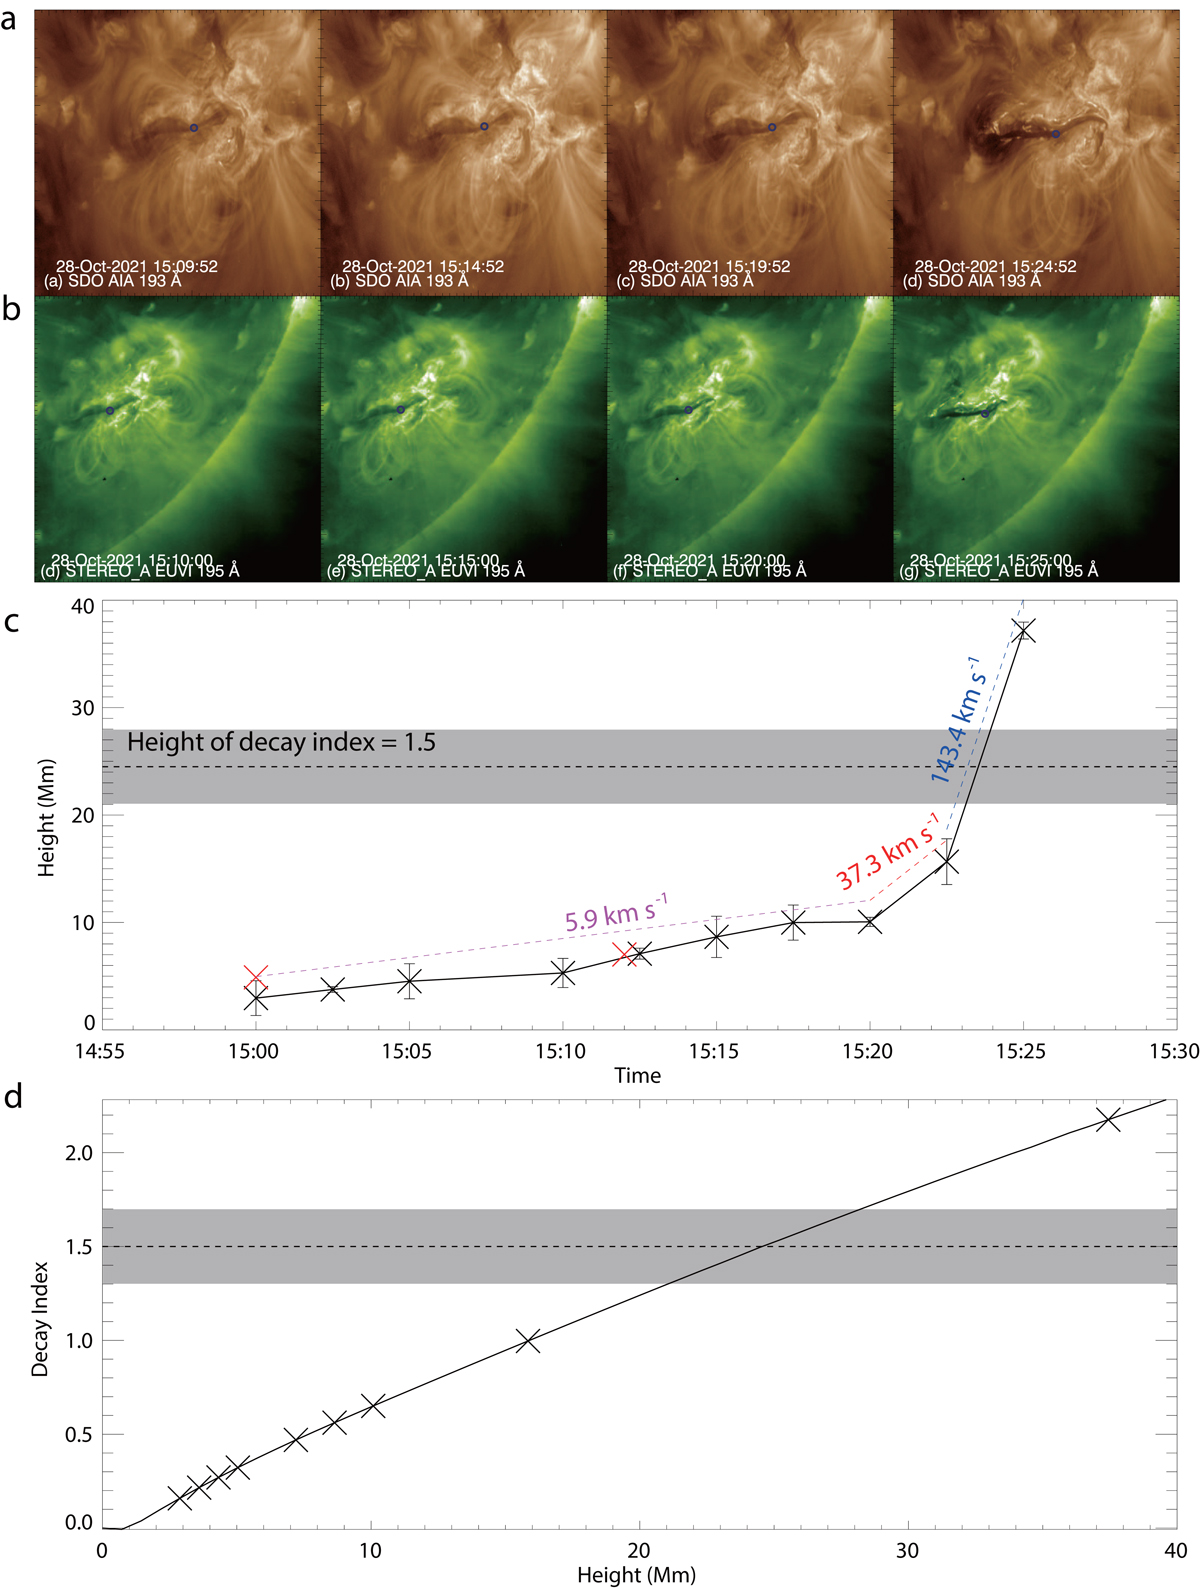
Fig. 6.
Download original image
Height evolution of the filament as determined by triangulation method combining SDO/AIA (a) with STEREO/EUVI (b) images. The highest point of the filament is denoted by the small circles in both the AIA and EUVI images. (c) Evolution of the height and the typical velocity. The uncertainty in the estimation of the height is denoted by the error bars. The two red crosses denote the heights of the MFR derived from the NLFFF extrapolations for time of 15:00 UT and 15:12 UT, respectively. The dashed lines shows the critical height of TI using the canonical threshold (1.5) of decay index, and the gray region shows the range of heights with decay indexes from 1.3 to 1.7. (d) Profile of the decay index of the strapping field. The heights of the filament shown in (c) are also denoted on the profile by the times symbols (×).
Current usage metrics show cumulative count of Article Views (full-text article views including HTML views, PDF and ePub downloads, according to the available data) and Abstracts Views on Vision4Press platform.
Data correspond to usage on the plateform after 2015. The current usage metrics is available 48-96 hours after online publication and is updated daily on week days.
Initial download of the metrics may take a while.