Fig. 5.
Download original image
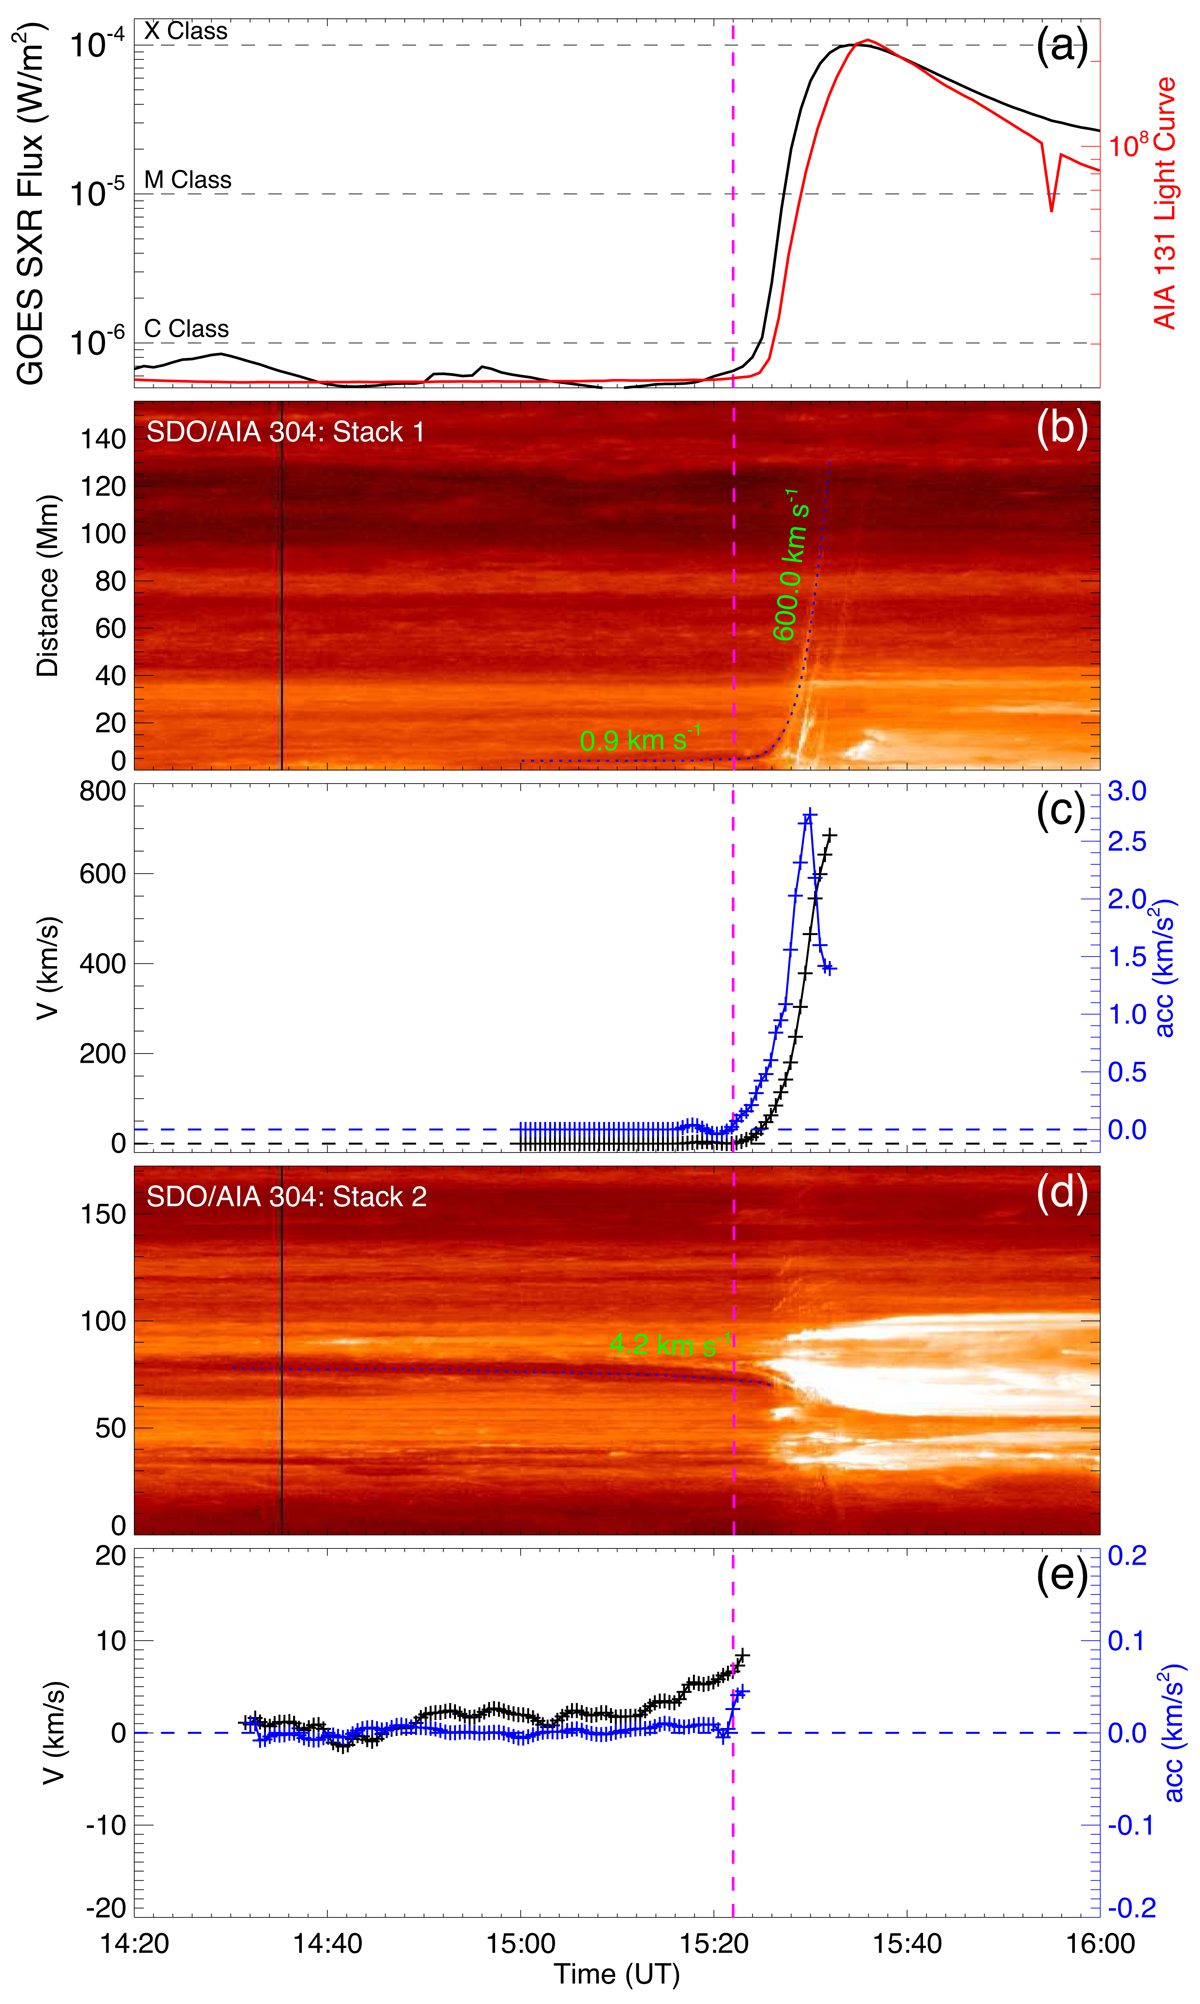
Velocity and acceleration of the filament eruption. (a) Evolutions of the GOES soft X-ray flux (dark solid line) and the source-integrated AIA 131 Å flux (red solid line) from 14:20 UT to 16:00 UT. (b) Stack plot (or Jmap) of the 304 Å intensities along slit 1, as denoted in Fig. 1c1, showing the fast rise of the filament. The dashed blue line tracks the leading edge of the erupting filament. (c) Temporal evolutions of the velocity and acceleration of the eruptive filaments as computed from the dashed blue line in panel b. (d) Stack plot along slit 2, as denoted in Fig. 1c1, which tracks mainly the slow rise of the filament before the eruption onset. (e) The velocity and acceleration for the slow rise of the filament are estimated from the dashed blue line in panel d. In all the panels, the vertical dashed line (in pink) denotes the time of 15:22 UT. An animation for the SDO/AIA 171 Å and 304 Å with a cadence of 12 s is attached (without the light curves).
Current usage metrics show cumulative count of Article Views (full-text article views including HTML views, PDF and ePub downloads, according to the available data) and Abstracts Views on Vision4Press platform.
Data correspond to usage on the plateform after 2015. The current usage metrics is available 48-96 hours after online publication and is updated daily on week days.
Initial download of the metrics may take a while.