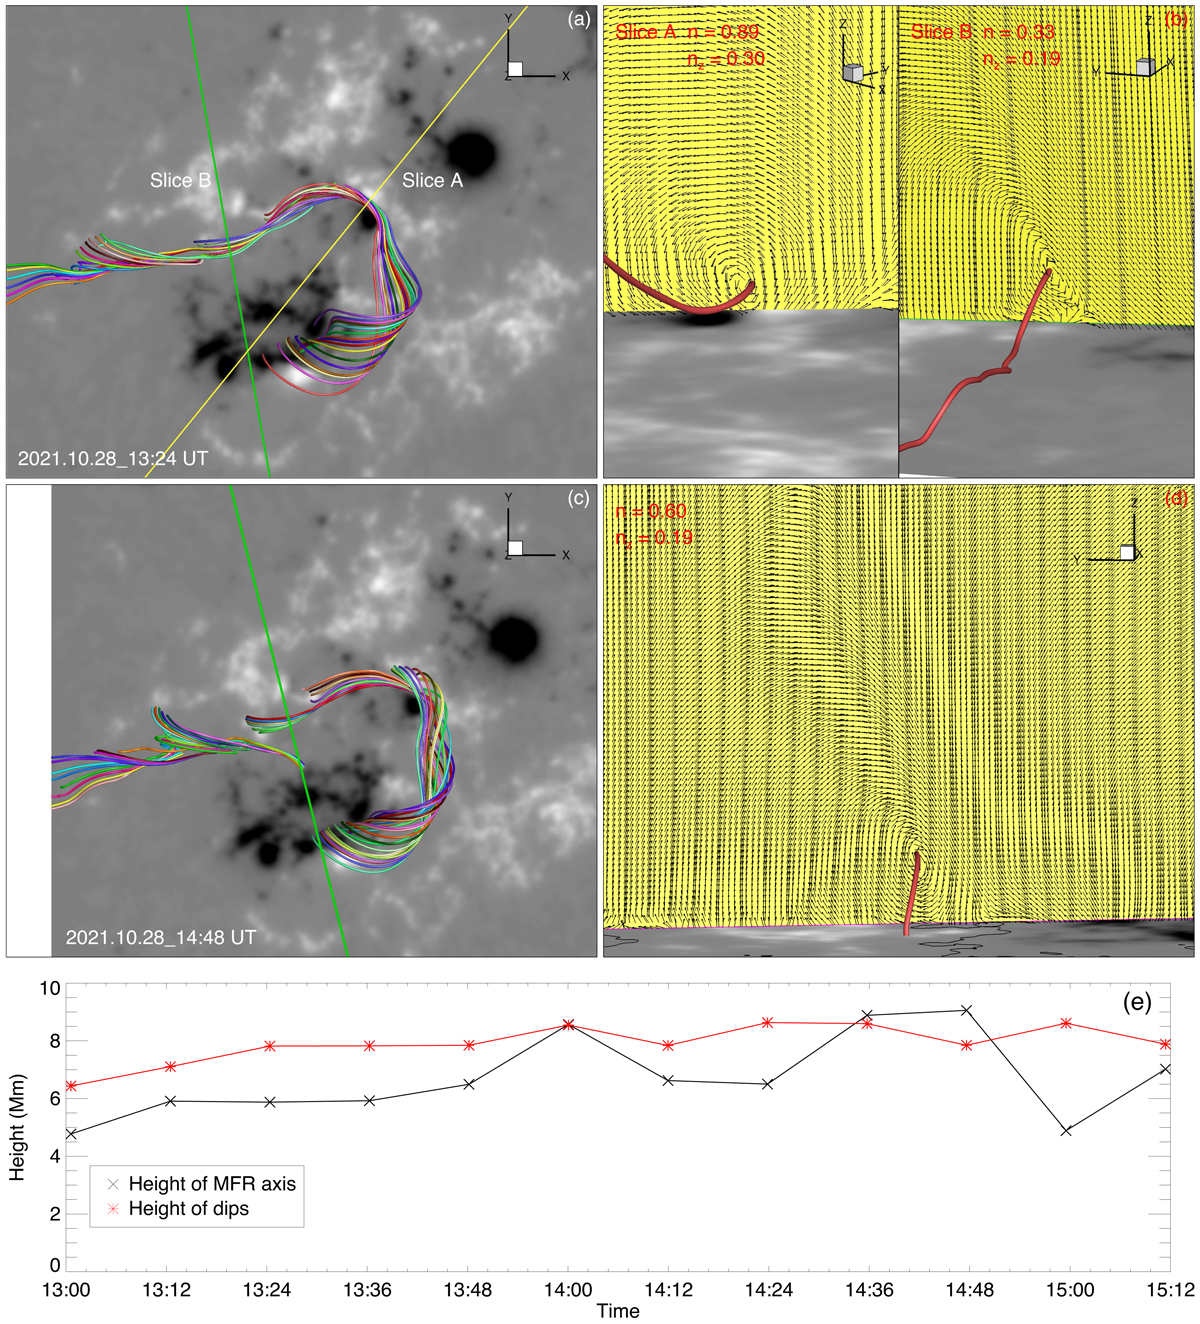
Fig. 4.
Download original image
Observations of the filament and the NLFFF reconstruction of the MFR. (a) Sampled field lines (in different colors) from the reconstructed magnetic field at 13:24 UT. (b) Two vertical cross sections of the MFR whose locations are denoted by the yellow and green lines in panel a. (c) Same as (a), but for 14:48 UT. (d) Vertical cross section of the MFR located at the position given by the green line in panel c. The arrows in both (b) and (d) show the directions of the transverse magnetic field on the slices, and they form rings centered at the red thick line, which is expected as the axis of the MFR. The decay index calculated at the axis of the MFR is denoted in each slice. (e) Evolution of the heights of the MFR axis and the magnetic dips at their highest point in the section corresponding to the earliest rising part of the filament during its eruption.
Current usage metrics show cumulative count of Article Views (full-text article views including HTML views, PDF and ePub downloads, according to the available data) and Abstracts Views on Vision4Press platform.
Data correspond to usage on the plateform after 2015. The current usage metrics is available 48-96 hours after online publication and is updated daily on week days.
Initial download of the metrics may take a while.