Fig. 8.
Download original image
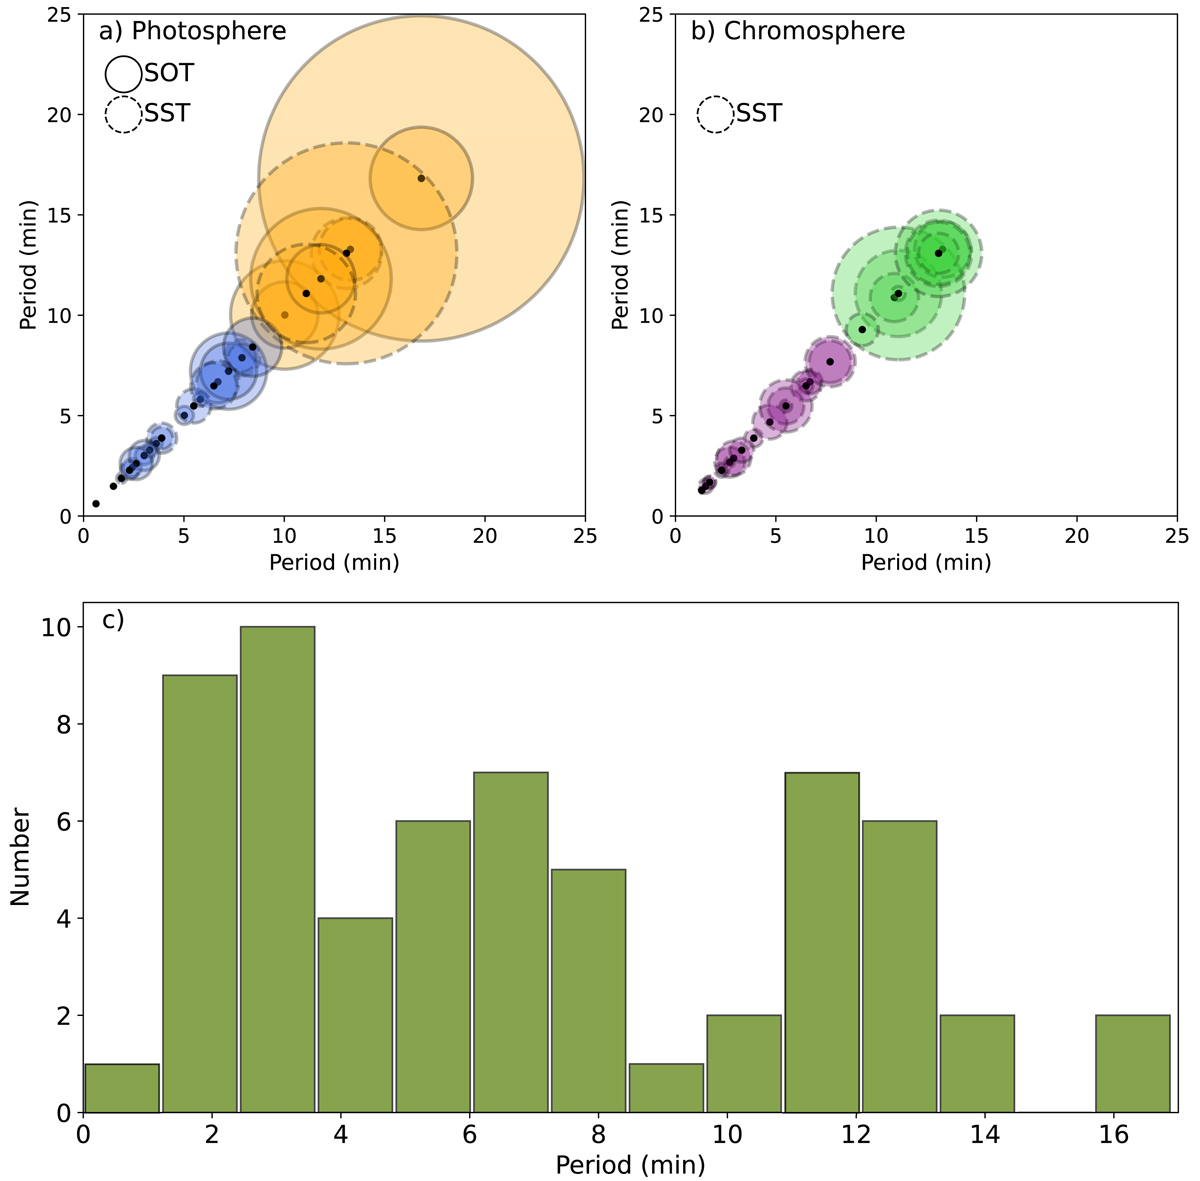
Distributions of significant periods. Panels a and b show the distributions of periods determined from all photospheric and chromospheric swirls. The solid (dashed) black circles depict SOT (SST) swirls. Different colours denote different clusters identified by the k-means clustering algorithm (see Sect. 3). Panel c shows the histogram of all periods in all five data sets.
Current usage metrics show cumulative count of Article Views (full-text article views including HTML views, PDF and ePub downloads, according to the available data) and Abstracts Views on Vision4Press platform.
Data correspond to usage on the plateform after 2015. The current usage metrics is available 48-96 hours after online publication and is updated daily on week days.
Initial download of the metrics may take a while.