Fig. 4.
Download original image
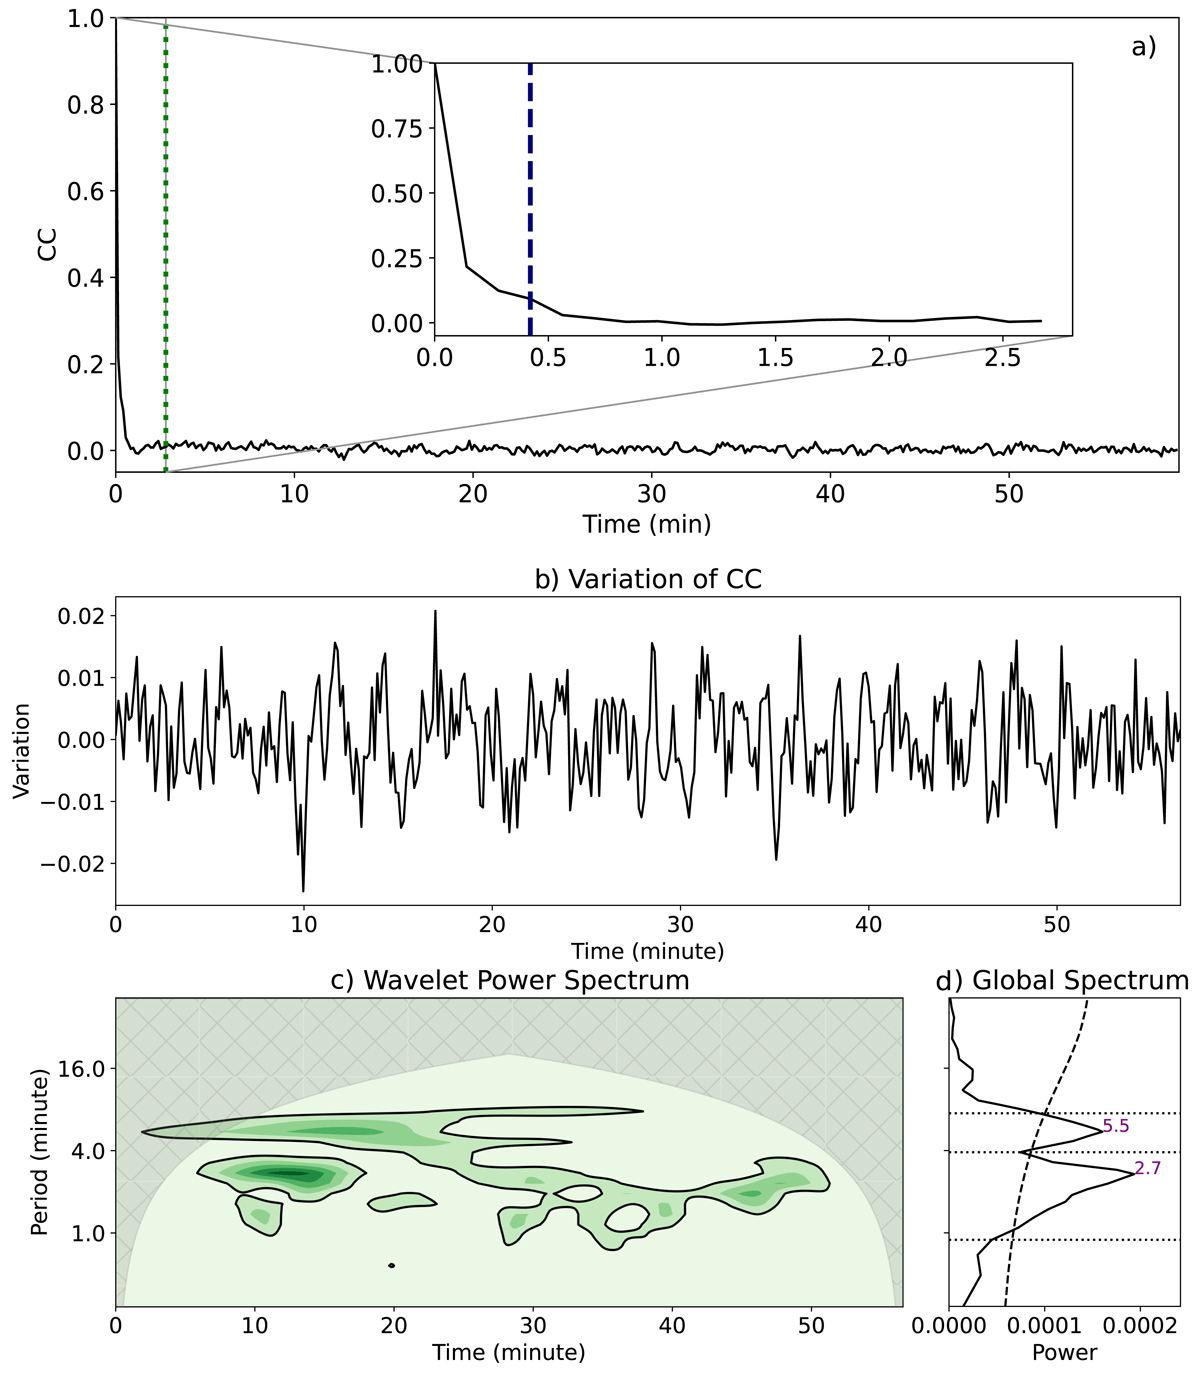
Variation in CC and its wavelet power spectrum. Panel a is the distribution of CC vs. time for the SST Hα line core chromospheric swirls. See Sect. 2 for the definition of the CC. The inset in panel a is a zoomed-in view of the region before the dashed green line. The dashed blue line corresponds to a CC of 0.1. Panel b shows the variation in CC after applying a highpass filter and subtracting its average value. Panel c is the corresponding wavelet power spectrum with darker colours for higher powers. The solid black curves are the local 95% confidence levels. The solid black curve in panel d is the global wavelet power. Purple text indicates peaks above the 95% confidence level (dashed black line). The dotted black lines are used to determine the extension of each peak.
Current usage metrics show cumulative count of Article Views (full-text article views including HTML views, PDF and ePub downloads, according to the available data) and Abstracts Views on Vision4Press platform.
Data correspond to usage on the plateform after 2015. The current usage metrics is available 48-96 hours after online publication and is updated daily on week days.
Initial download of the metrics may take a while.