Fig. 3.
Download original image
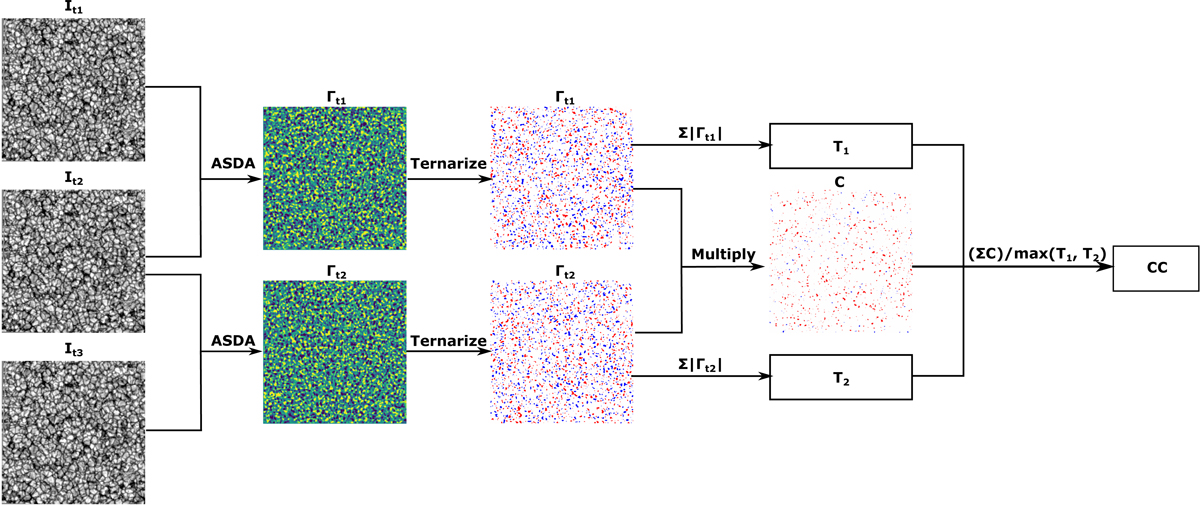
Flowchart of how the correlation coefficient (CC) is calculated. It1, It2, and It3 are three frames of the intensity observations. Two Γ2 maps (Γt1 and Γt2) are generated from these three intensity observations employing ASDA (Liu et al. 2019a). They are further ternarised to contain only values of −1, 0, and 1. These ternarised Γ2 maps are then used to calculate CC. For more information, see the text provided in Sect. 2.
Current usage metrics show cumulative count of Article Views (full-text article views including HTML views, PDF and ePub downloads, according to the available data) and Abstracts Views on Vision4Press platform.
Data correspond to usage on the plateform after 2015. The current usage metrics is available 48-96 hours after online publication and is updated daily on week days.
Initial download of the metrics may take a while.