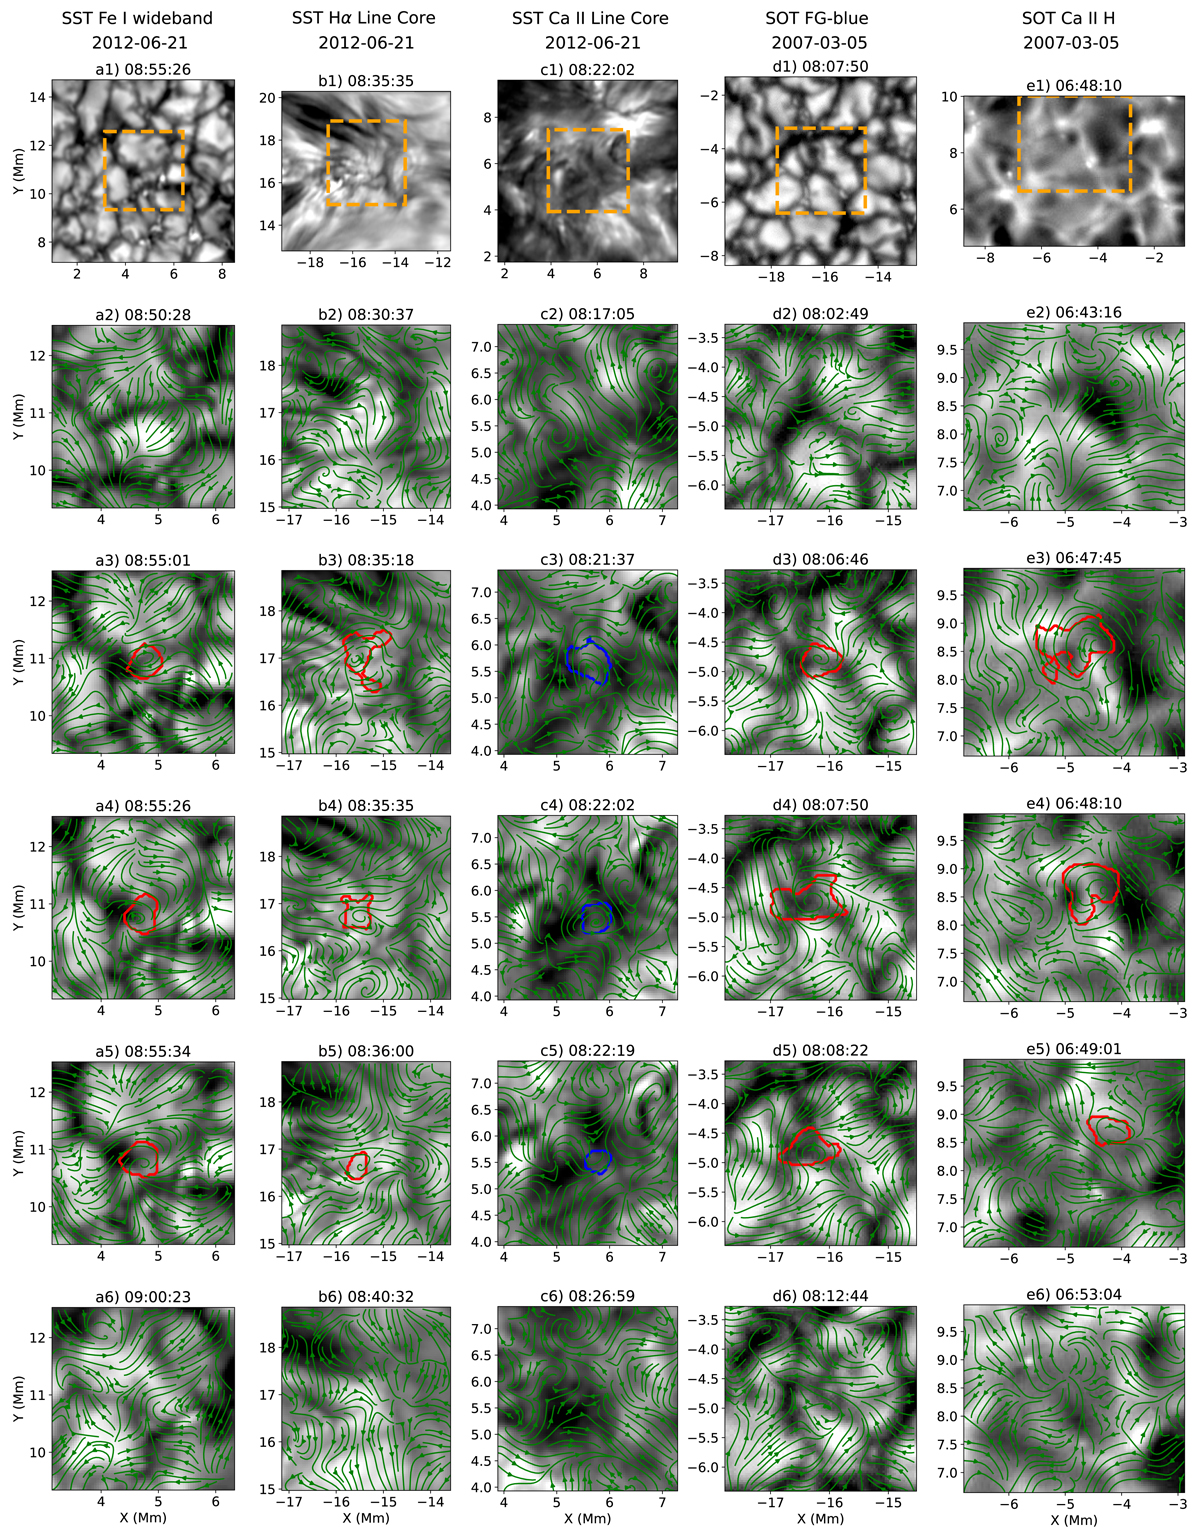
Fig. 2.
Download original image
Examples of individual swirls in SST and Hinode observations. The black and white backgrounds are the corresponding intensities at each passband. Rows 2–6 are the zoom-in views of the orange boxes in the first row. Green arrows are velocity fields estimated using FLCT. The red and blue curves are the edges of the example swirls with clockwise and counter-clockwise rotations, respectively (see main text for details).
Current usage metrics show cumulative count of Article Views (full-text article views including HTML views, PDF and ePub downloads, according to the available data) and Abstracts Views on Vision4Press platform.
Data correspond to usage on the plateform after 2015. The current usage metrics is available 48-96 hours after online publication and is updated daily on week days.
Initial download of the metrics may take a while.