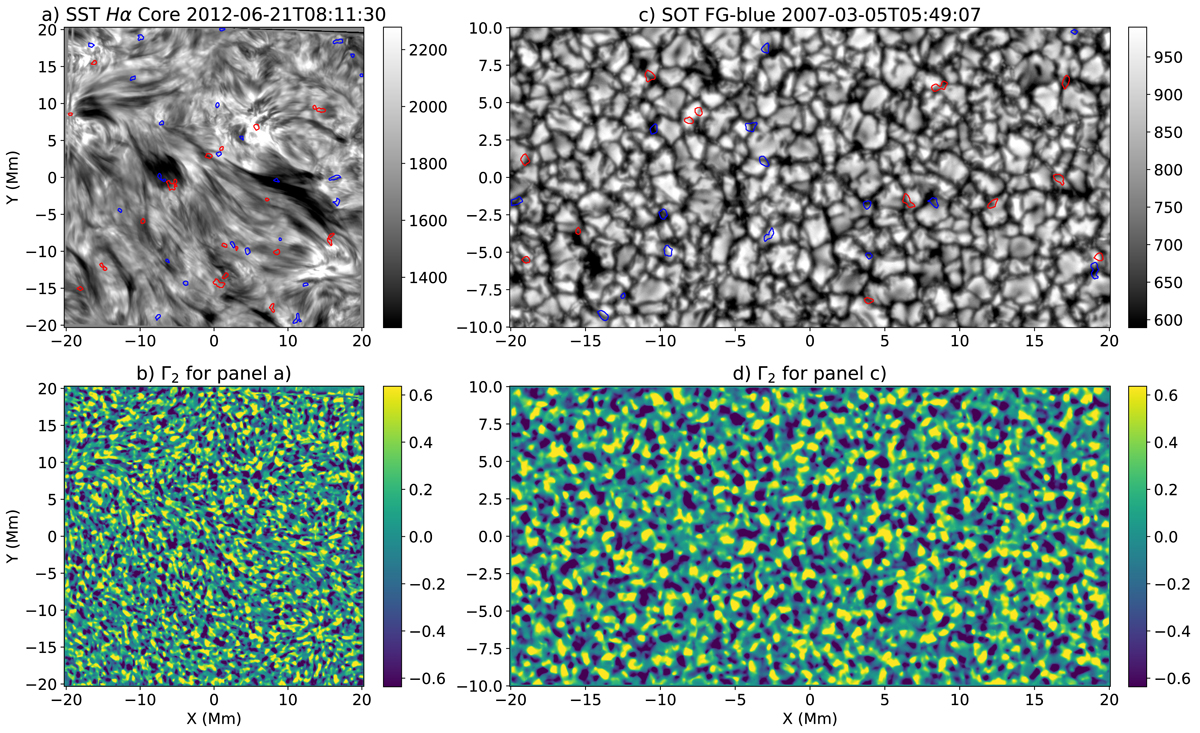
Fig. 1.
Download original image
Examples of swirls detected in SST and Hinode observations. the black and white backgrounds in panels a and c are the SST Hα line core chromospheric and SOT FG blue photospheric observations on 21 June 2012 and 5 March 2007, respectively. Red and blue contours are swirls detected by ASDA (Liu et al. 2019a) with clockwise and counter-clockwise rotations, respectively. Panels b and d are the Γ2 maps, corresponding to observations in panels a and c. Γ2 values are used to define edges of swirls (see e.g. Graftieaux et al. 2001; Liu et al. 2019a). Figure axes represent physical distances across the surface of the Sun (in Mm), with the origin of the chosen domain placed at the centre of the observing FOV.
Current usage metrics show cumulative count of Article Views (full-text article views including HTML views, PDF and ePub downloads, according to the available data) and Abstracts Views on Vision4Press platform.
Data correspond to usage on the plateform after 2015. The current usage metrics is available 48-96 hours after online publication and is updated daily on week days.
Initial download of the metrics may take a while.