Open Access
Fig. 9
Download original image
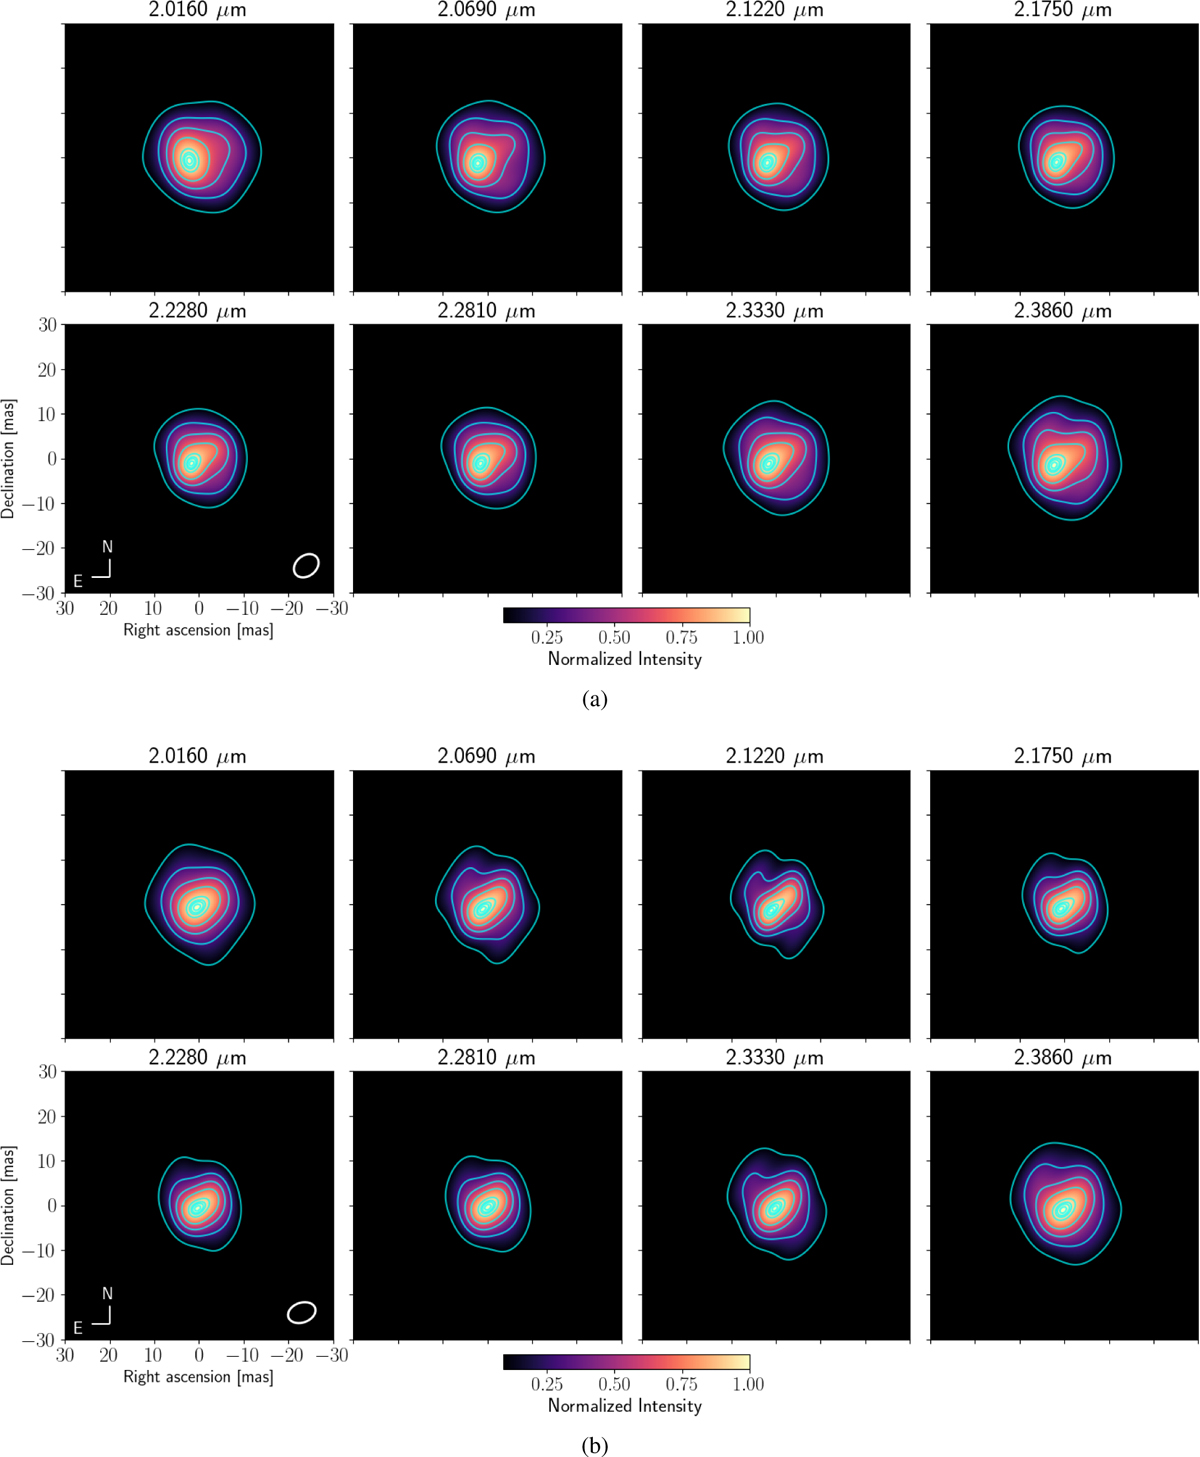
Best pseudo-continuum reconstructed images for the (a) January and (b) February epochs. The white ellipse located in the right corner of the image at 2.0160 μm corresponds to the mean synthesized primary beam. The blue contours represent 10, 30, 50, 70 90, 95, 97, and 99% of the intensity’s peak.
Current usage metrics show cumulative count of Article Views (full-text article views including HTML views, PDF and ePub downloads, according to the available data) and Abstracts Views on Vision4Press platform.
Data correspond to usage on the plateform after 2015. The current usage metrics is available 48-96 hours after online publication and is updated daily on week days.
Initial download of the metrics may take a while.