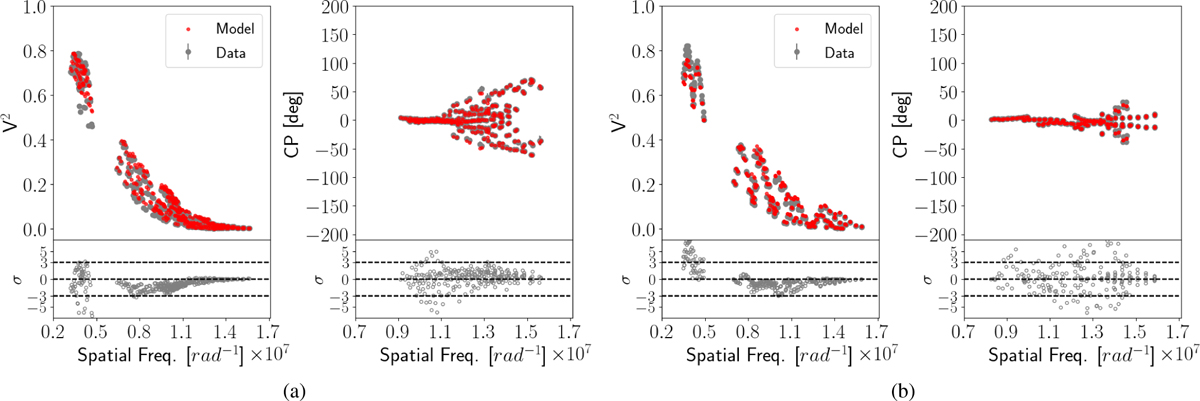
Fig. B.1
Download original image
Best-fit to observed V2 and CPs from the best reconstructed images across the pseudo-continuum for the (a) January and (b) February epochs. The red dots in the main panel correspond to the synthetic V2 and CPs extracted from the raw reconstructed images. The data are shown with gray dots in the main panels. The lower panels show the residuals (in terms of the number of standard deviations) coming from the comparison between the data and the best-fit reconstructed images.
Current usage metrics show cumulative count of Article Views (full-text article views including HTML views, PDF and ePub downloads, according to the available data) and Abstracts Views on Vision4Press platform.
Data correspond to usage on the plateform after 2015. The current usage metrics is available 48-96 hours after online publication and is updated daily on week days.
Initial download of the metrics may take a while.