Open Access
Fig. 17
Download original image
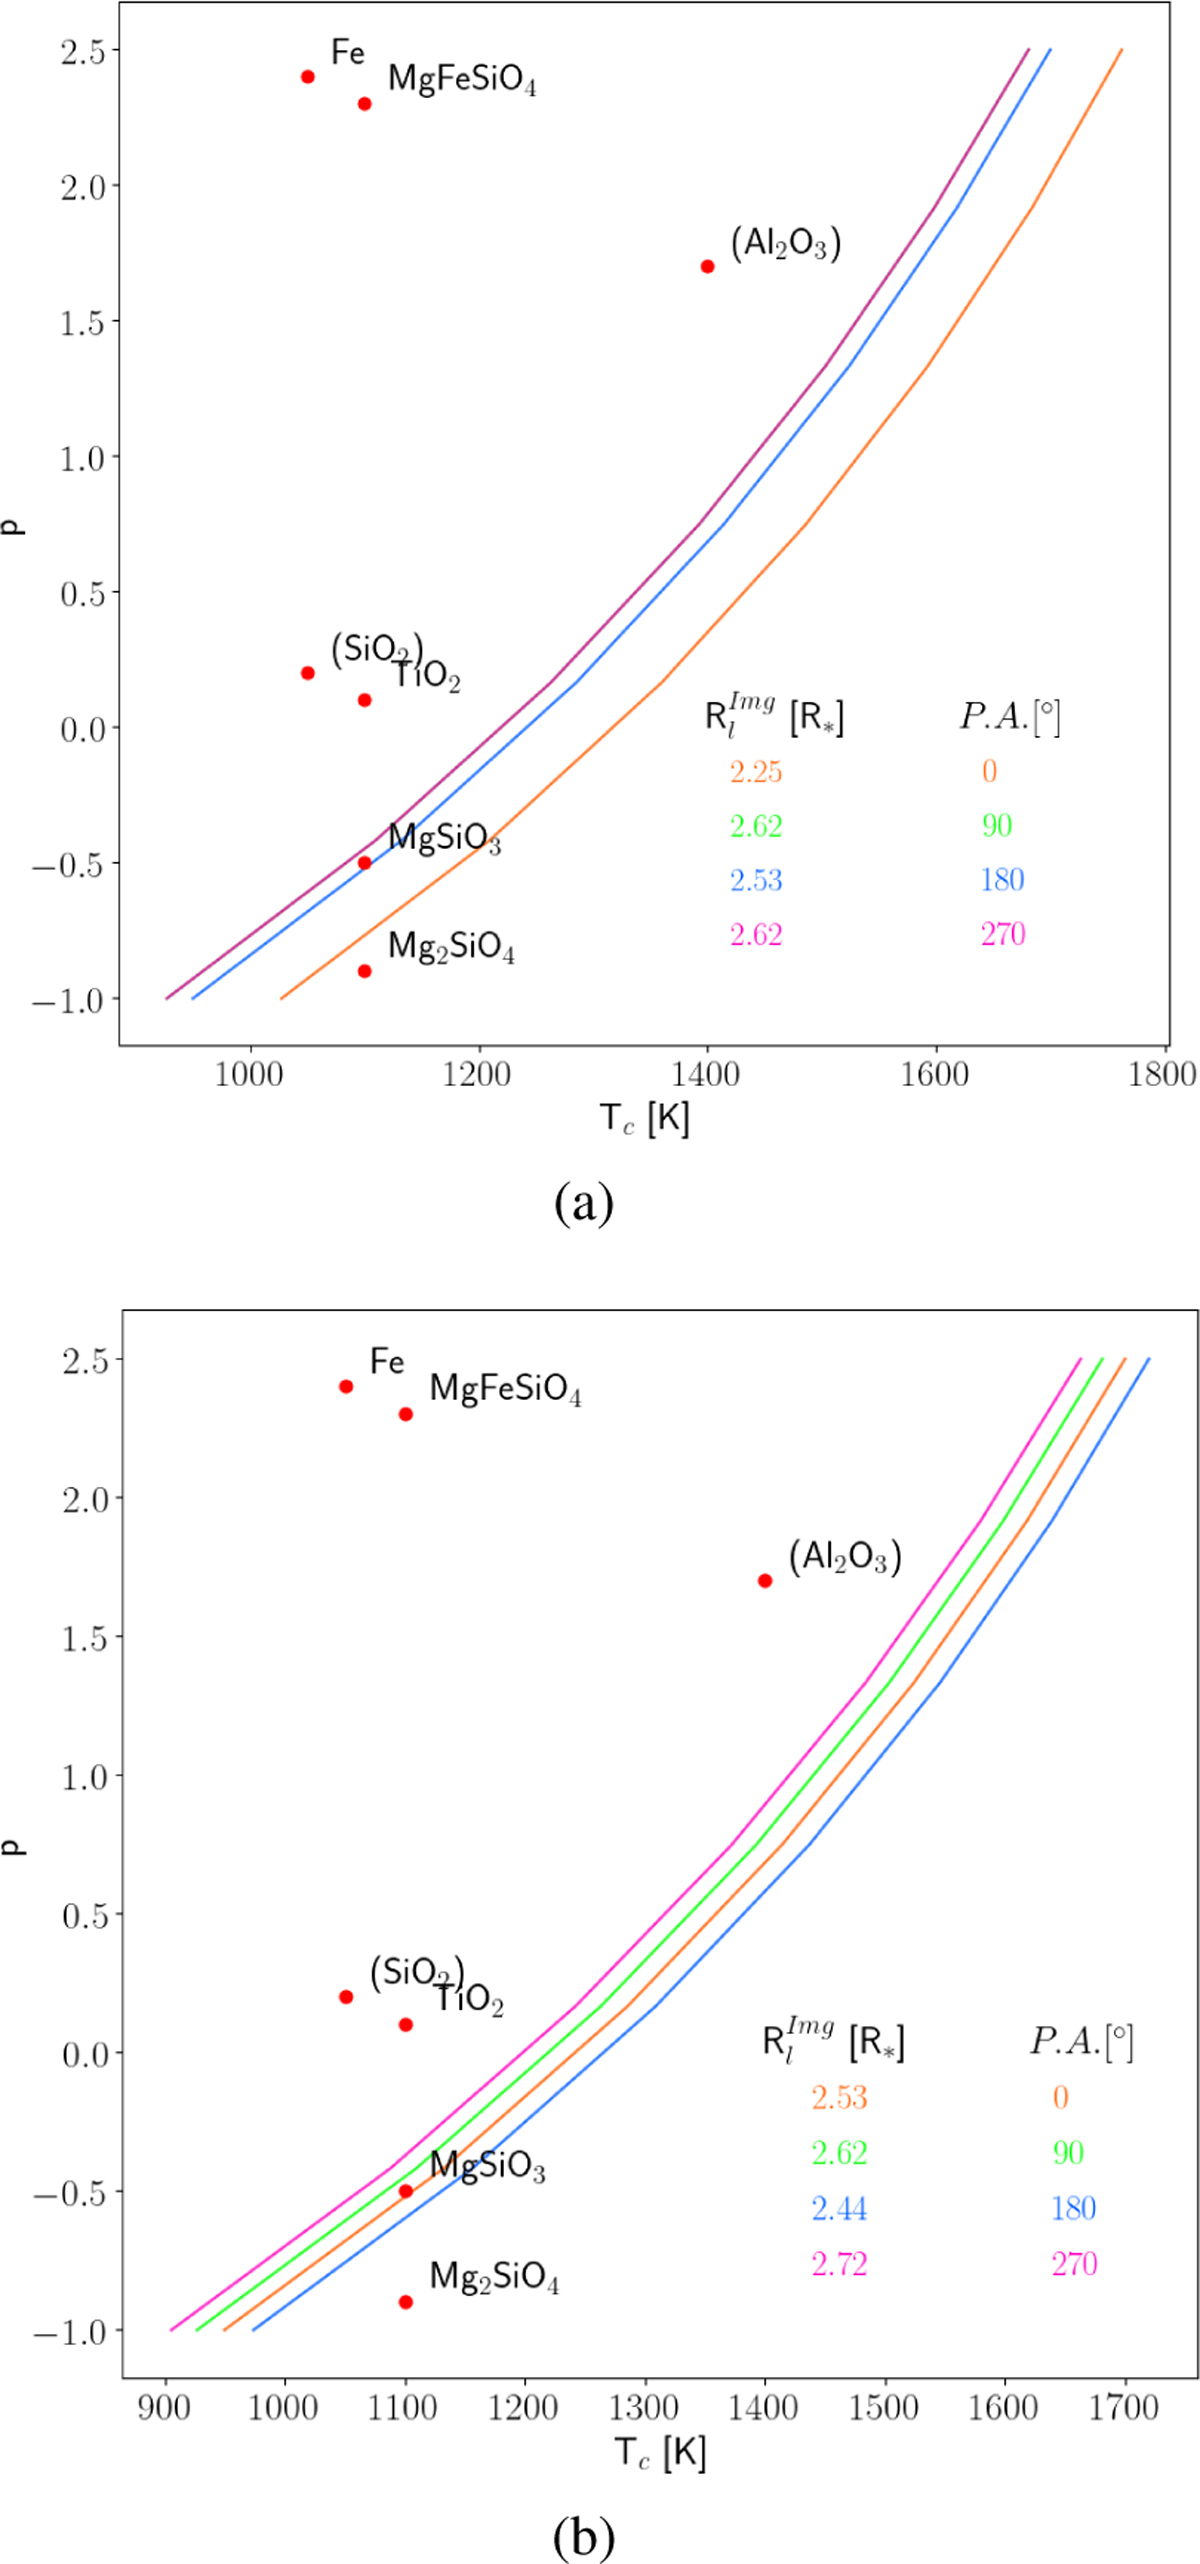
Panels similar to Fig. 16 but showing the median condensation radii obtained directly from the pure-line CO reconstructed images at different position angles (see labels on the panels) for (a) the January and (b) February epochs.
Current usage metrics show cumulative count of Article Views (full-text article views including HTML views, PDF and ePub downloads, according to the available data) and Abstracts Views on Vision4Press platform.
Data correspond to usage on the plateform after 2015. The current usage metrics is available 48-96 hours after online publication and is updated daily on week days.
Initial download of the metrics may take a while.