Fig. 16
Download original image
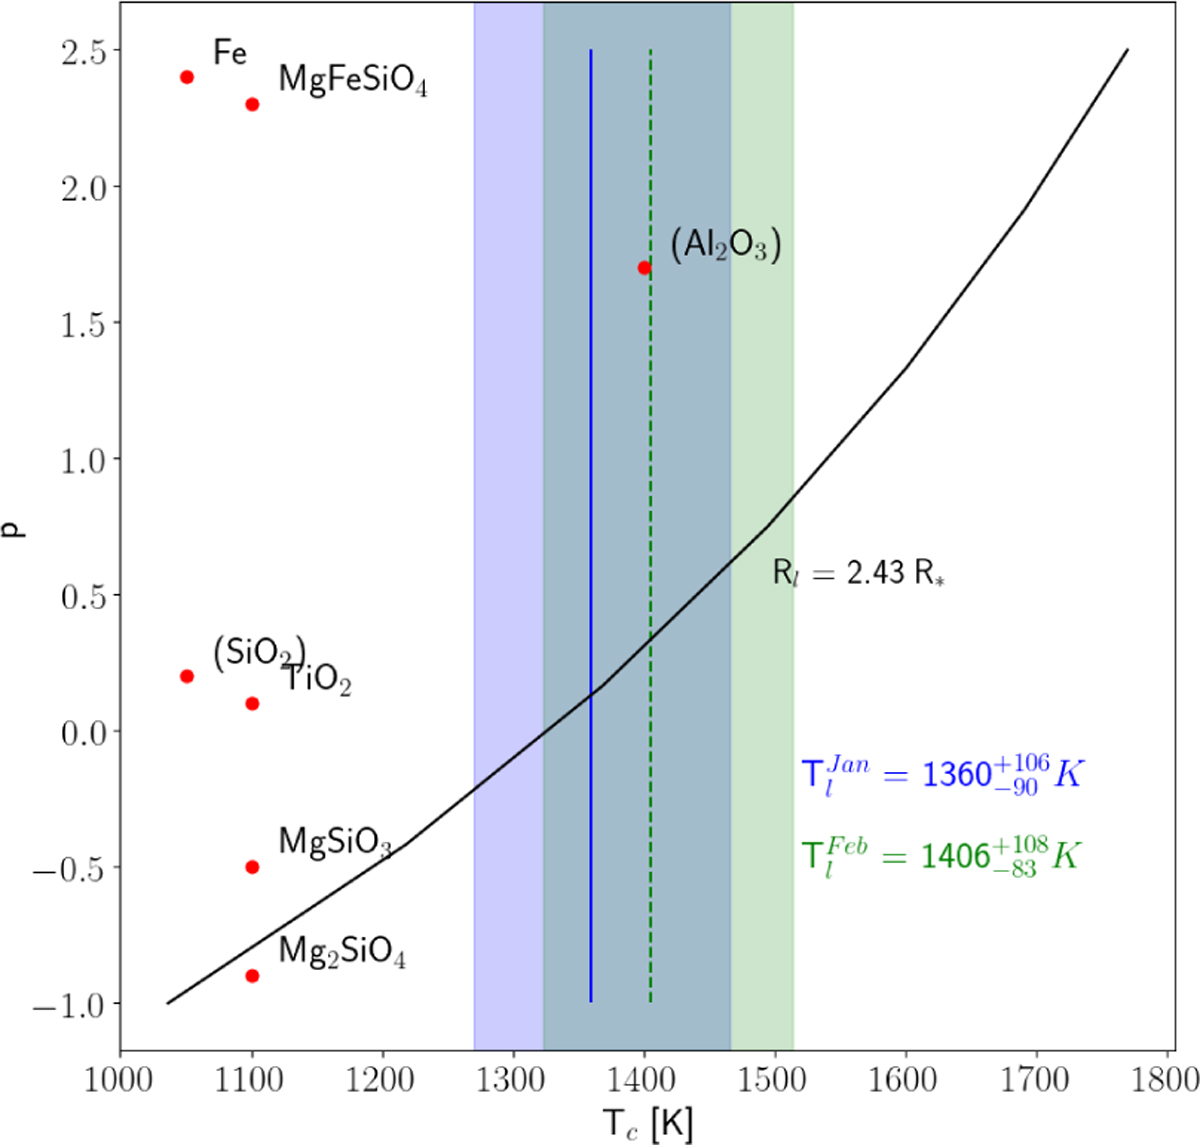
Curve of constant levitation radius (Rl = 2.43 R*) represented with a solid-black line. The plot shows the condensation temperature, Tc, as a function of the dust absorption coefficient, p. The red circles indicate the positions of a variety of dust grains. The blue and green shaded regions correspond to the CO temperature ranges estimated from the single-layer model (see labels on the plot).
Current usage metrics show cumulative count of Article Views (full-text article views including HTML views, PDF and ePub downloads, according to the available data) and Abstracts Views on Vision4Press platform.
Data correspond to usage on the plateform after 2015. The current usage metrics is available 48-96 hours after online publication and is updated daily on week days.
Initial download of the metrics may take a while.