Open Access
Fig. 14
Download original image
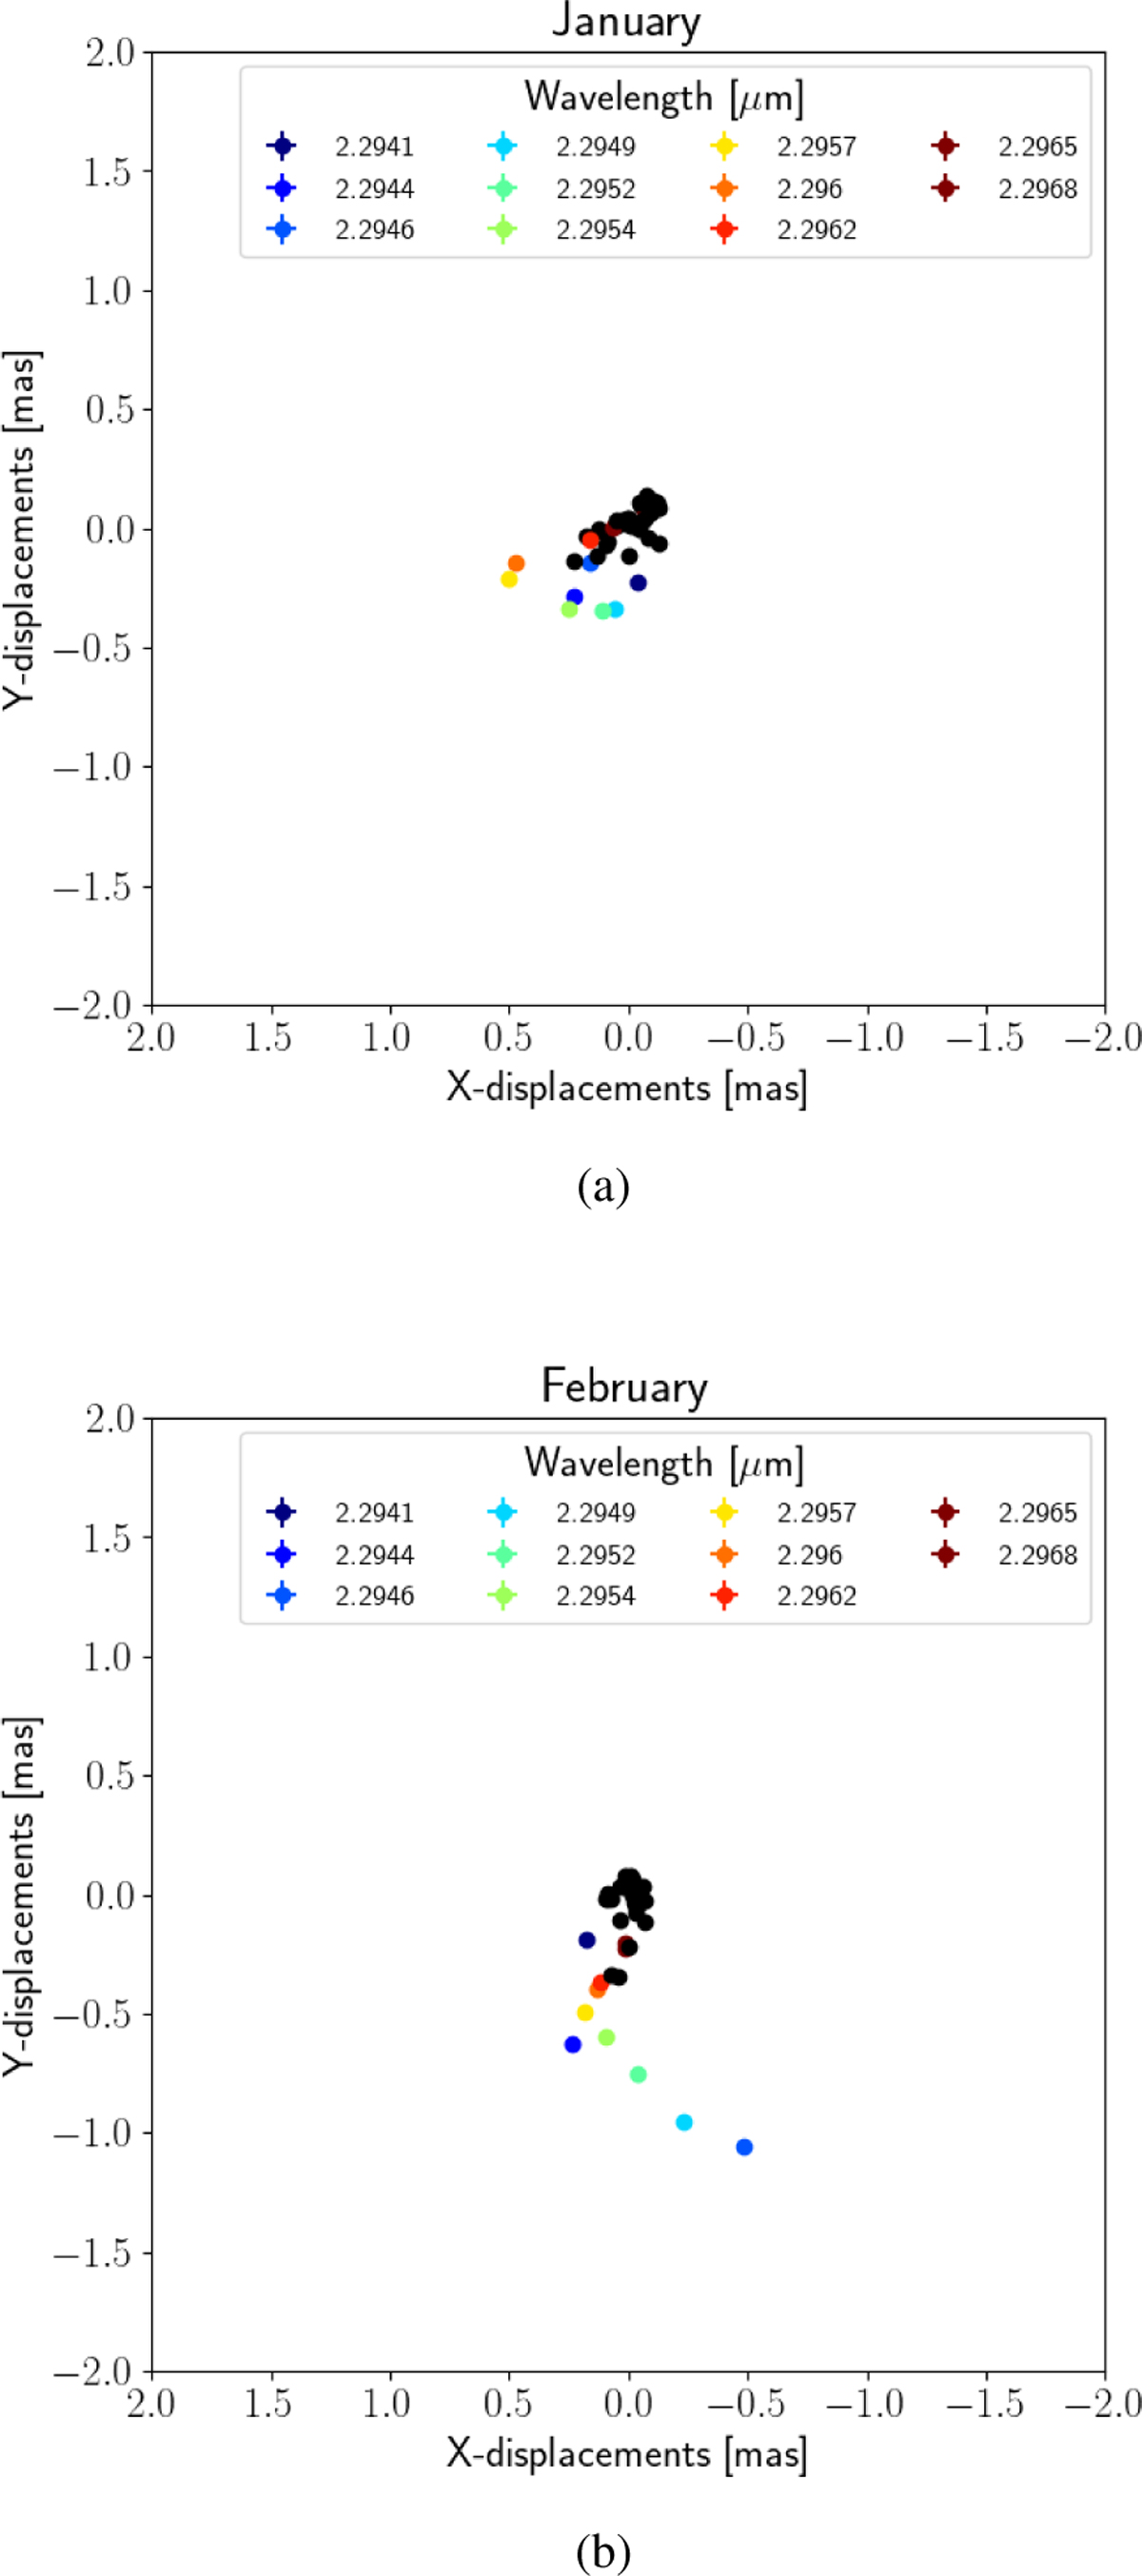
Two-dimensional photocenter offsets in mas. The black dots correspond to the photocenter position of the continuum emission and the labeled colored dots to the photo-centers of the CO band head. The error bars of the reported displacements are smaller than the used symbols.
Current usage metrics show cumulative count of Article Views (full-text article views including HTML views, PDF and ePub downloads, according to the available data) and Abstracts Views on Vision4Press platform.
Data correspond to usage on the plateform after 2015. The current usage metrics is available 48-96 hours after online publication and is updated daily on week days.
Initial download of the metrics may take a while.