Open Access
Fig. 13
Download original image
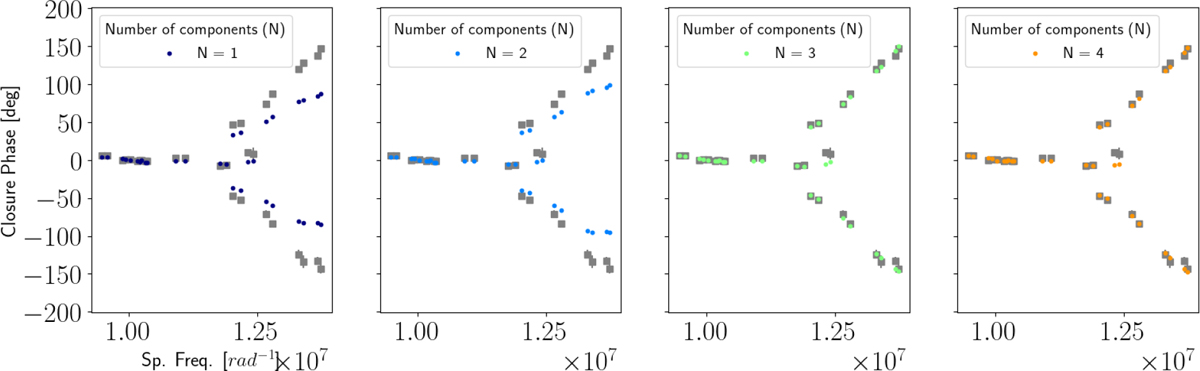
Representative example of CPs versus spatial frequencies of the data set that corresponds to the first CO band head at 2.2946 μm (gray squares). The colored dots show the CPs from the recovered images obtained with different numbers of principal components (see label on the plot).
Current usage metrics show cumulative count of Article Views (full-text article views including HTML views, PDF and ePub downloads, according to the available data) and Abstracts Views on Vision4Press platform.
Data correspond to usage on the plateform after 2015. The current usage metrics is available 48-96 hours after online publication and is updated daily on week days.
Initial download of the metrics may take a while.