Fig. 12
Download original image
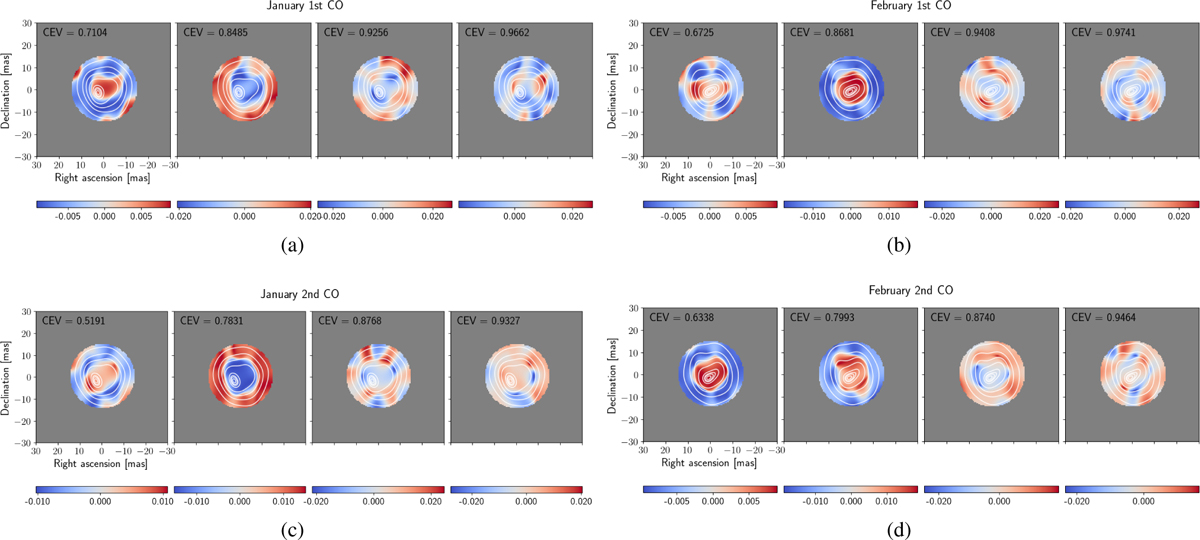
First four principal components for the January and February epochs for the first CO (plots a and b) and the second CO band heads (plots e and f). The relative scale of the structures in the eigenimages is displayed with a color bar at the bottom of each panel. Only the central 20 mas of the eigenimages are shown in each panel. The white contours correspond to the mean image across wavelength (per given data set) and they represent 10, 30, 50, 70, 90, 95, 97, and 99% of the intensity’s peak.
Current usage metrics show cumulative count of Article Views (full-text article views including HTML views, PDF and ePub downloads, according to the available data) and Abstracts Views on Vision4Press platform.
Data correspond to usage on the plateform after 2015. The current usage metrics is available 48-96 hours after online publication and is updated daily on week days.
Initial download of the metrics may take a while.