Open Access
Fig. 1
Download original image
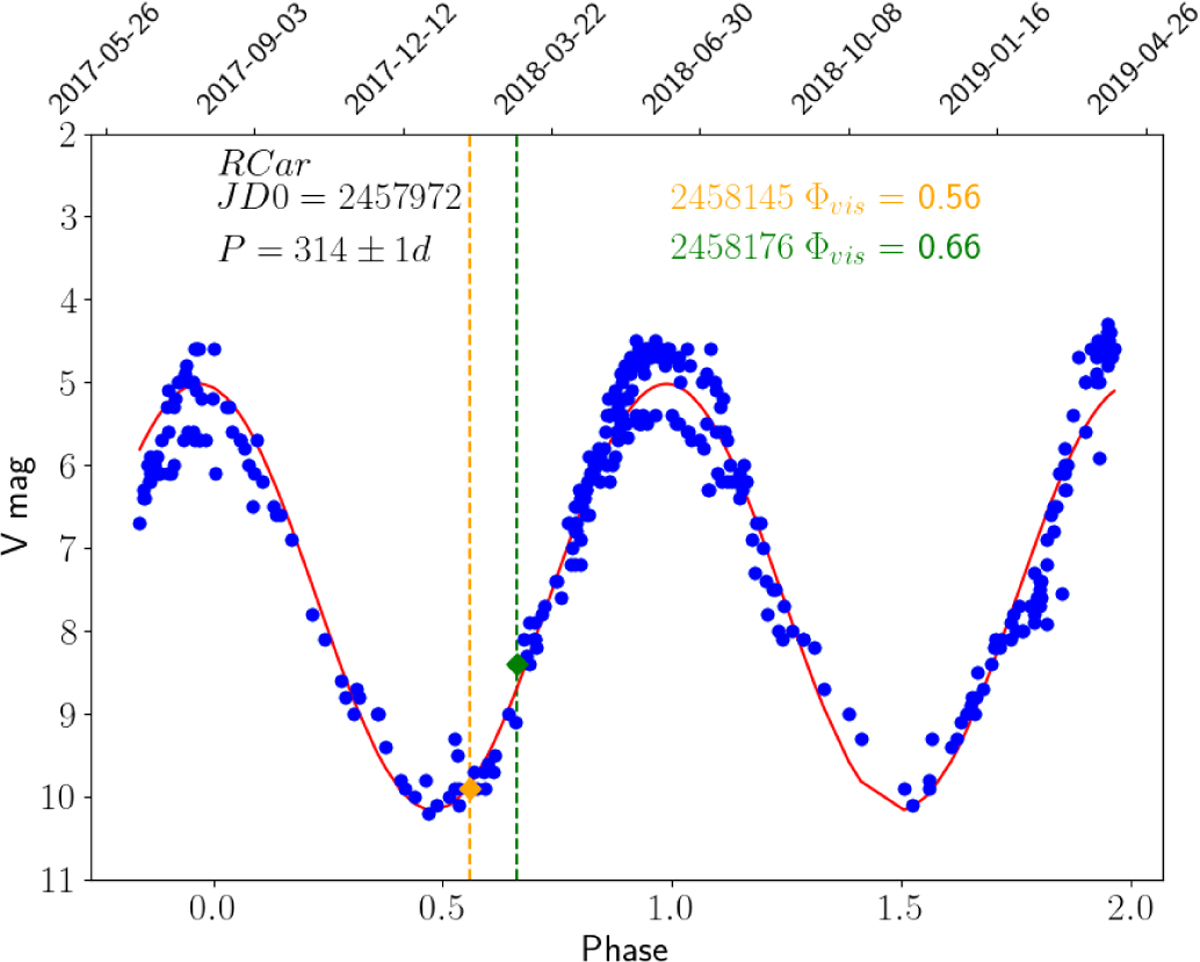
Visual light curve of R Car based on AAVSO database (blue points). The red line represents the best fit of a sine function to the curve which results in a period of P = 314 ± 1 days. The dashed vertical lines and the colored diamonds show the epochs of our 2018 GRAVITY observations (see the labels on the plot).
Current usage metrics show cumulative count of Article Views (full-text article views including HTML views, PDF and ePub downloads, according to the available data) and Abstracts Views on Vision4Press platform.
Data correspond to usage on the plateform after 2015. The current usage metrics is available 48-96 hours after online publication and is updated daily on week days.
Initial download of the metrics may take a while.