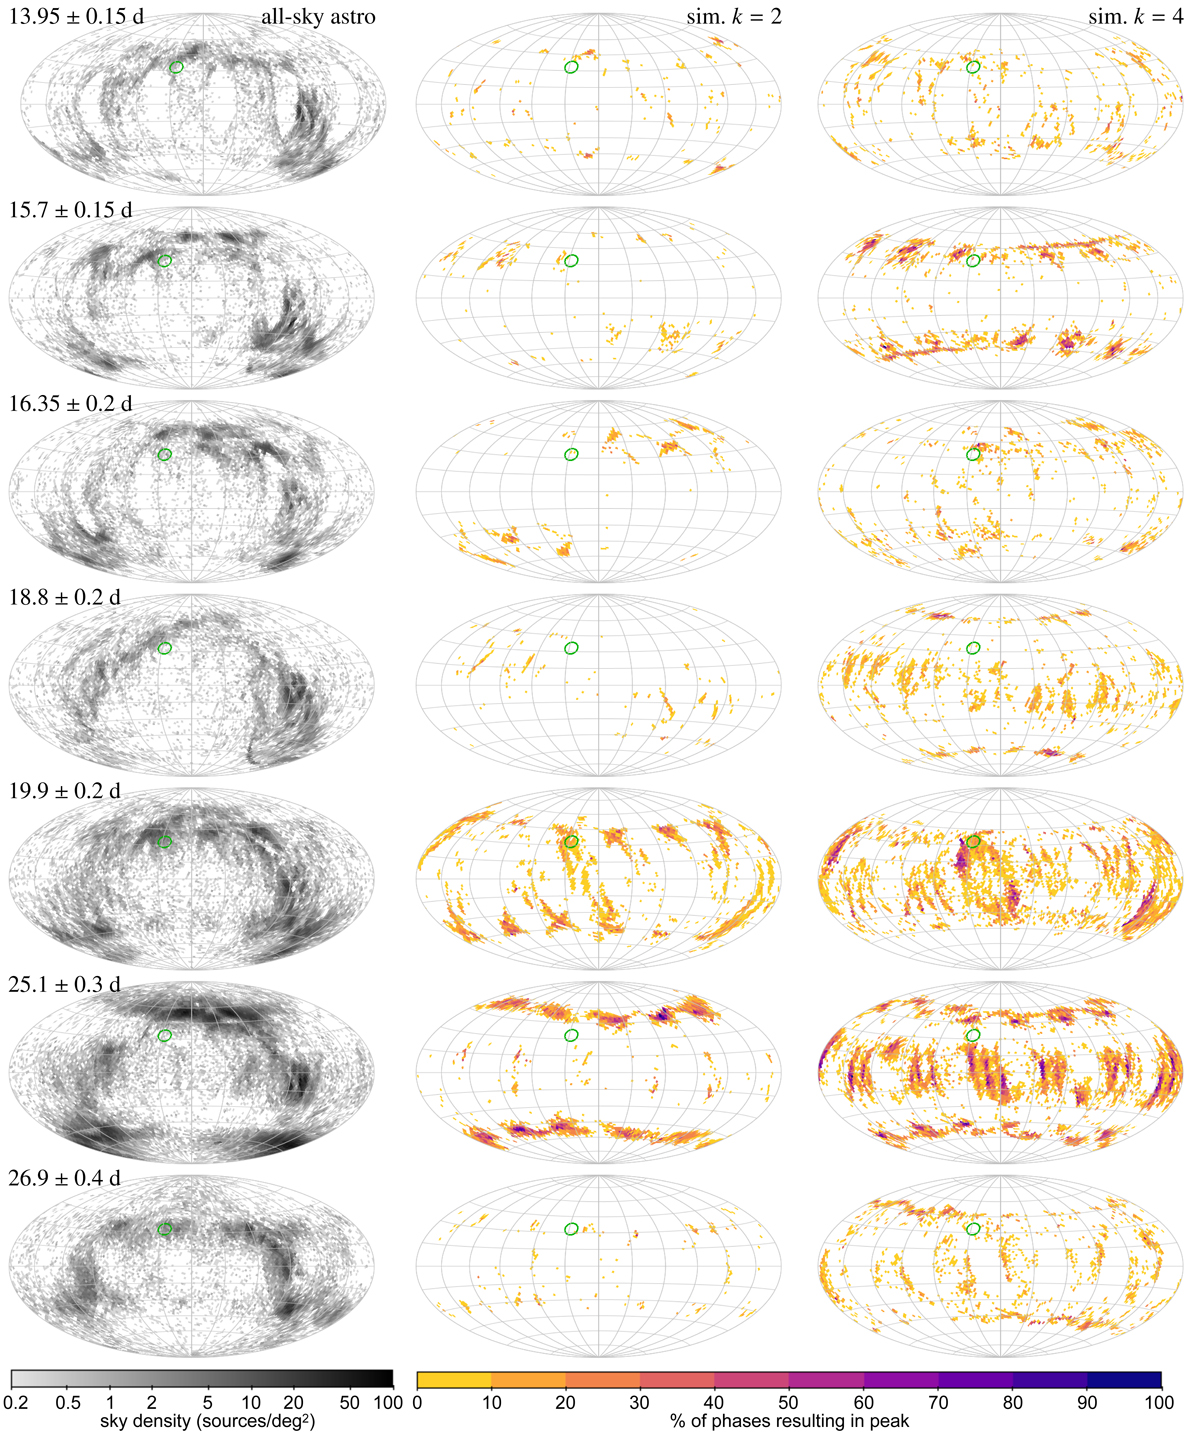
Fig. C.6.
Download original image
Ecliptic Aitoff projection of the astrometric period data presented in Fig. 24. Left: Source density of the astrometric peaks for the all-sky sample (top panel of Fig. 24). Right: Result of the all-sky uniform simulations of our noiseless sampled bias model (panels 2 and 3 of Fig. 24). They are colour-coded with the percentage of phases (position angles) that results in this peak: a low value means that only specific phasing of the scan-angle signal will result in a particular peak being observed at the given location. The green circle indicates the location of the GAPS catalogue. In all sky plots longitude zero is at the centre and increases to the left.
Current usage metrics show cumulative count of Article Views (full-text article views including HTML views, PDF and ePub downloads, according to the available data) and Abstracts Views on Vision4Press platform.
Data correspond to usage on the plateform after 2015. The current usage metrics is available 48-96 hours after online publication and is updated daily on week days.
Initial download of the metrics may take a while.