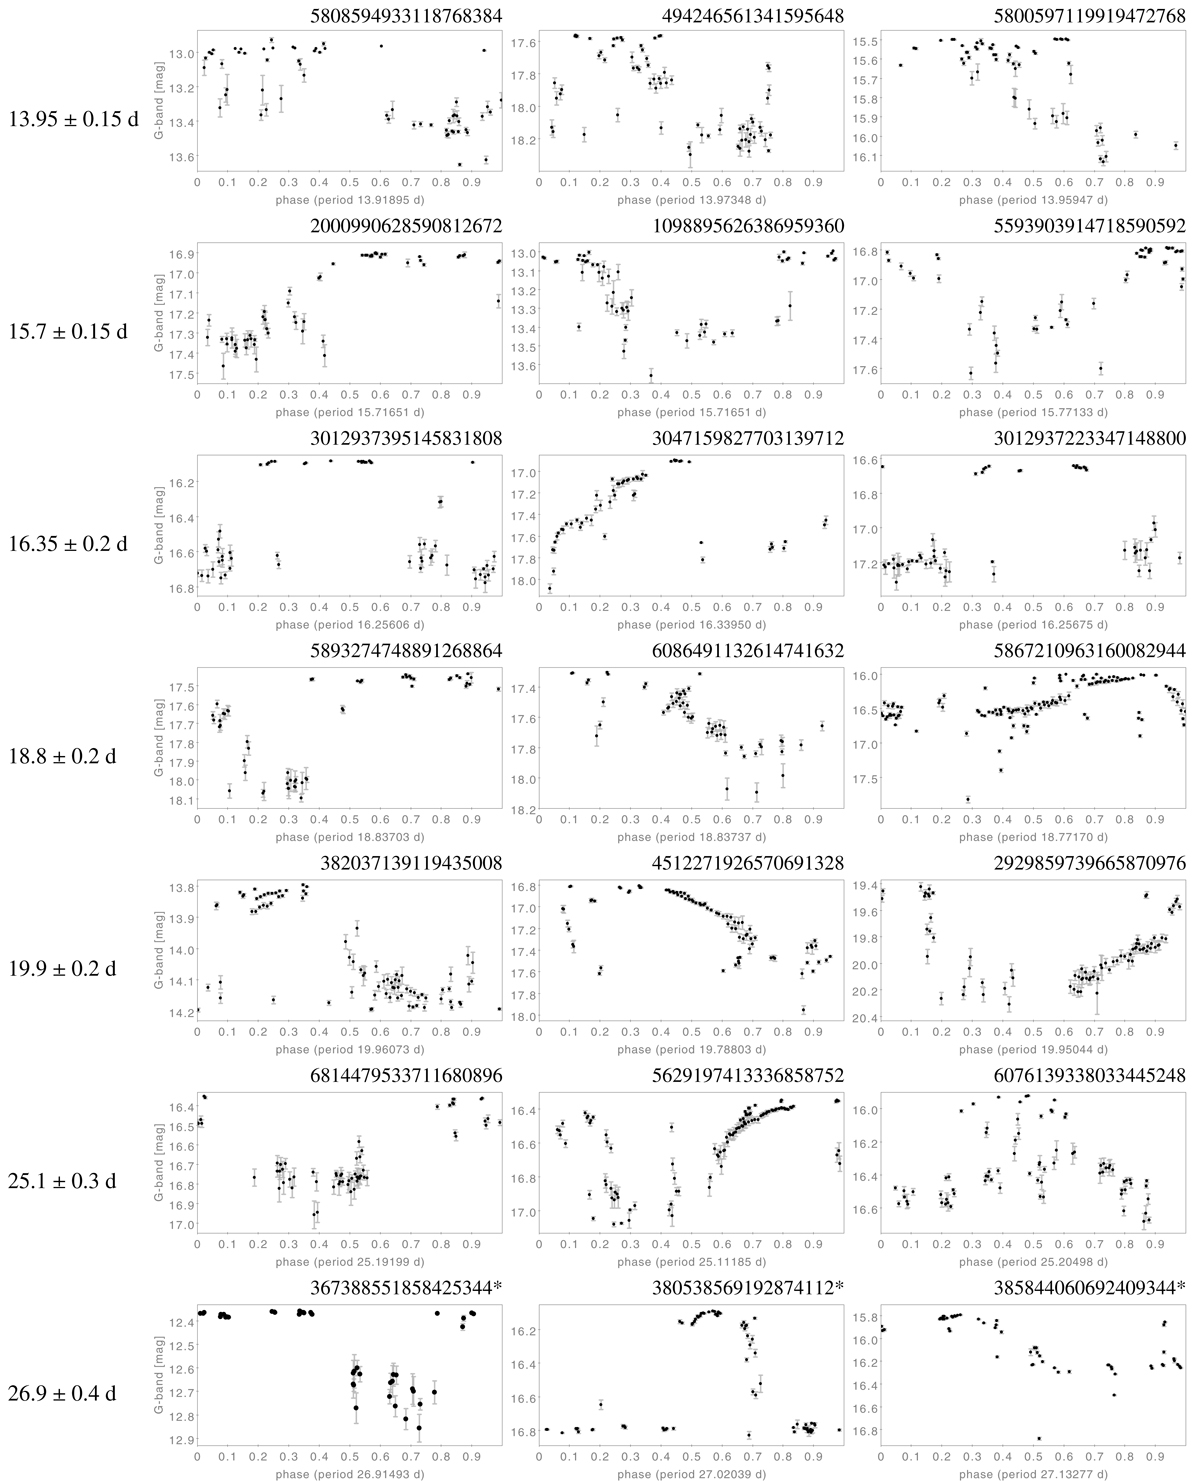
Fig. C.4.
Download original image
Example public folded G-band light curves for different period peaks, derived by the multi-harmonic modelling following a generalised least-squares period search as described in Sect. 4.1. The source id is provided in the top right corner. Additional information is available in Table 1 for sources with an asterisk. In general, the sources either have very high ripd, G, rexf, G, or aG significance (but always a low false-alarm probability).
Current usage metrics show cumulative count of Article Views (full-text article views including HTML views, PDF and ePub downloads, according to the available data) and Abstracts Views on Vision4Press platform.
Data correspond to usage on the plateform after 2015. The current usage metrics is available 48-96 hours after online publication and is updated daily on week days.
Initial download of the metrics may take a while.