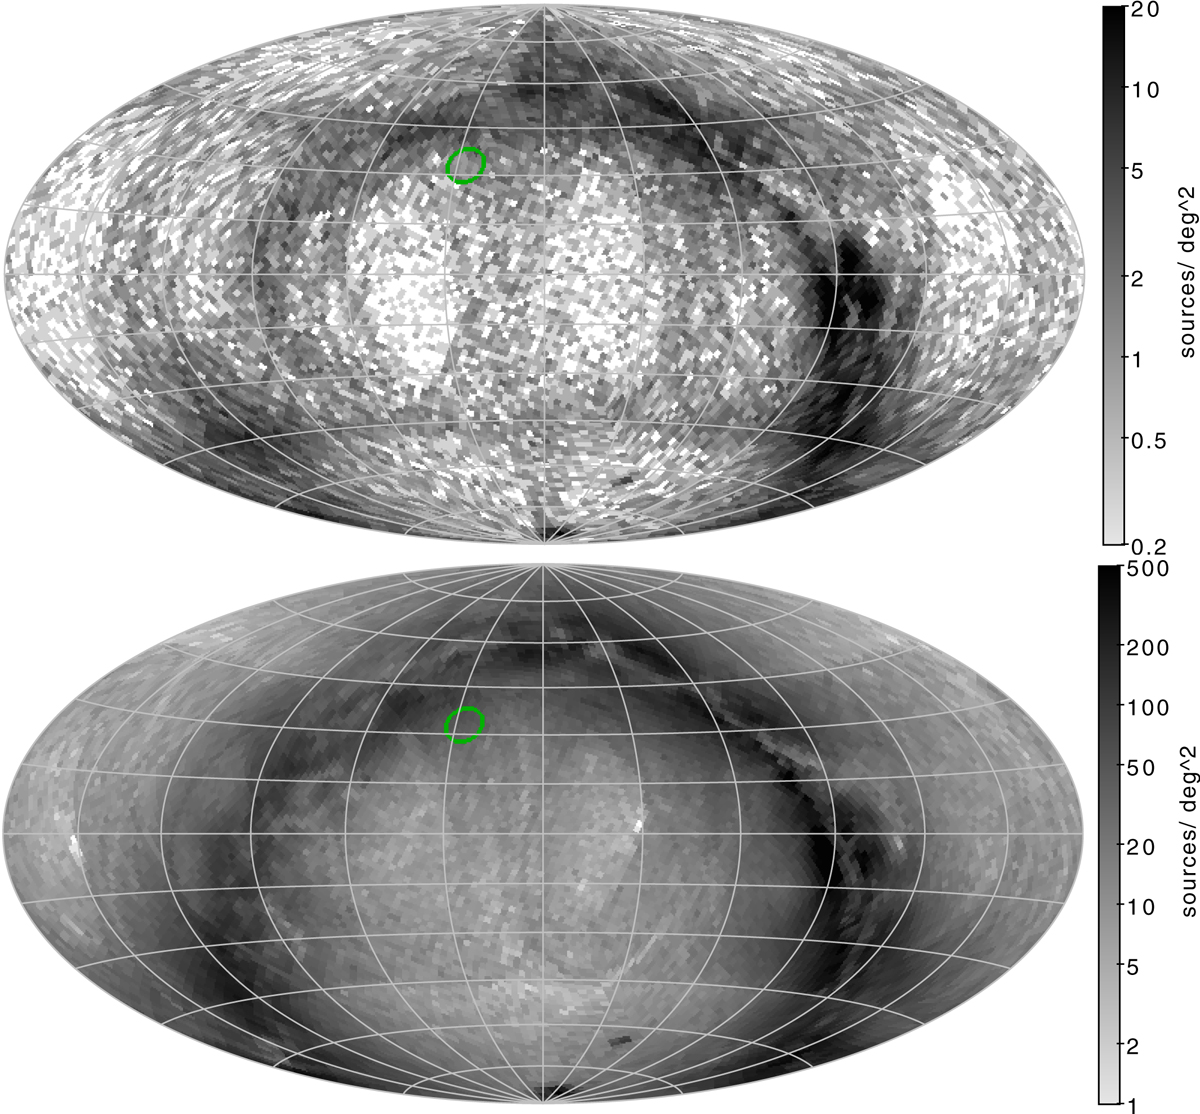
Fig. C.1.
Download original image
Ecliptic Aitoff projection with longitude zero at the centre and increasing to the left. Top: Sky density of the (unpublished) all-sky photometric sample, subsets of which for different period ranges are shown in Figs. C.2 and C.3. Bottom: Sky density of the (unpublished) all-sky astrometric sample, subsets of which for different period ranges are shown in Figs. C.6 and C.7. Both samples are introduced in Sect. 4.1. The green circle indicates the location of the GAPS catalogue (see Fig. 23).
Current usage metrics show cumulative count of Article Views (full-text article views including HTML views, PDF and ePub downloads, according to the available data) and Abstracts Views on Vision4Press platform.
Data correspond to usage on the plateform after 2015. The current usage metrics is available 48-96 hours after online publication and is updated daily on week days.
Initial download of the metrics may take a while.