Fig. 4.
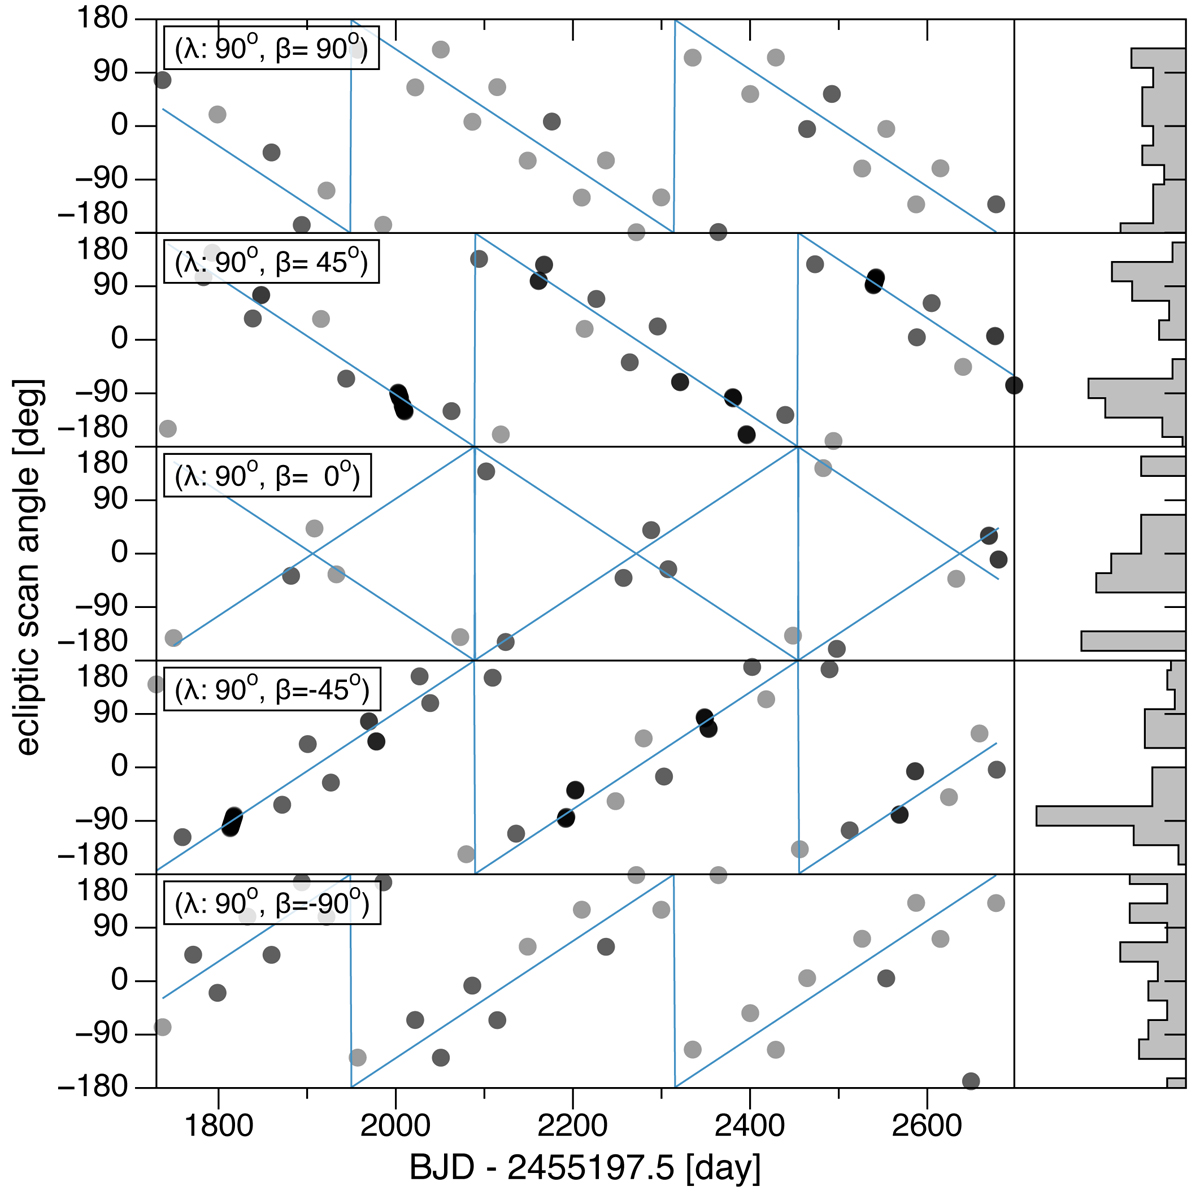
Download original image
Time series of the ecliptic scan-angle distribution during the Gaia DR3 NSL time range for five ecliptic latitudes along the half-circle slice with ecliptic longitude λ = 90° (same as the top panel of Fig. 3). Each point is semi-transparent, so that a darker colour means more observations. Blue cyclic lines illustrate the slopes due to the yearly rotation around the Sun. The histogram on the right side has a bin size of 32.7° (360/11) and shows the relative distribution of scan angles, corresponding to the top panel of Fig. 3 for the specified ecliptic latitudes.
Current usage metrics show cumulative count of Article Views (full-text article views including HTML views, PDF and ePub downloads, according to the available data) and Abstracts Views on Vision4Press platform.
Data correspond to usage on the plateform after 2015. The current usage metrics is available 48-96 hours after online publication and is updated daily on week days.
Initial download of the metrics may take a while.