Fig. A.5.
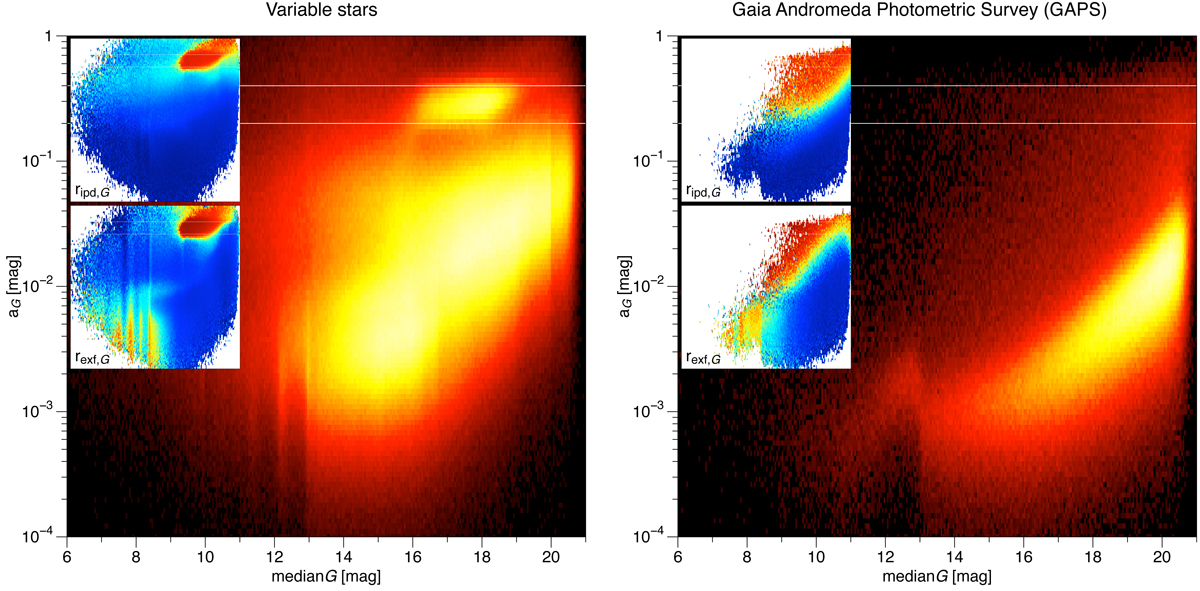
Download original image
Density of the median G-band magnitude dependence of aG, the amplitude of the small-separation binary model fit to the G-band photometry (Eq. 5). The top left inset images shows the same data colour-coded with the median ripd, G and rexf, G, respectively, both ranging between 0 (blue) and 1 (red). See Sect. 6.3 for discussion. Plots are restricted to sources with N3band ≥ 20 and NnoEpsl, G ≥ 20.
Current usage metrics show cumulative count of Article Views (full-text article views including HTML views, PDF and ePub downloads, according to the available data) and Abstracts Views on Vision4Press platform.
Data correspond to usage on the plateform after 2015. The current usage metrics is available 48-96 hours after online publication and is updated daily on week days.
Initial download of the metrics may take a while.