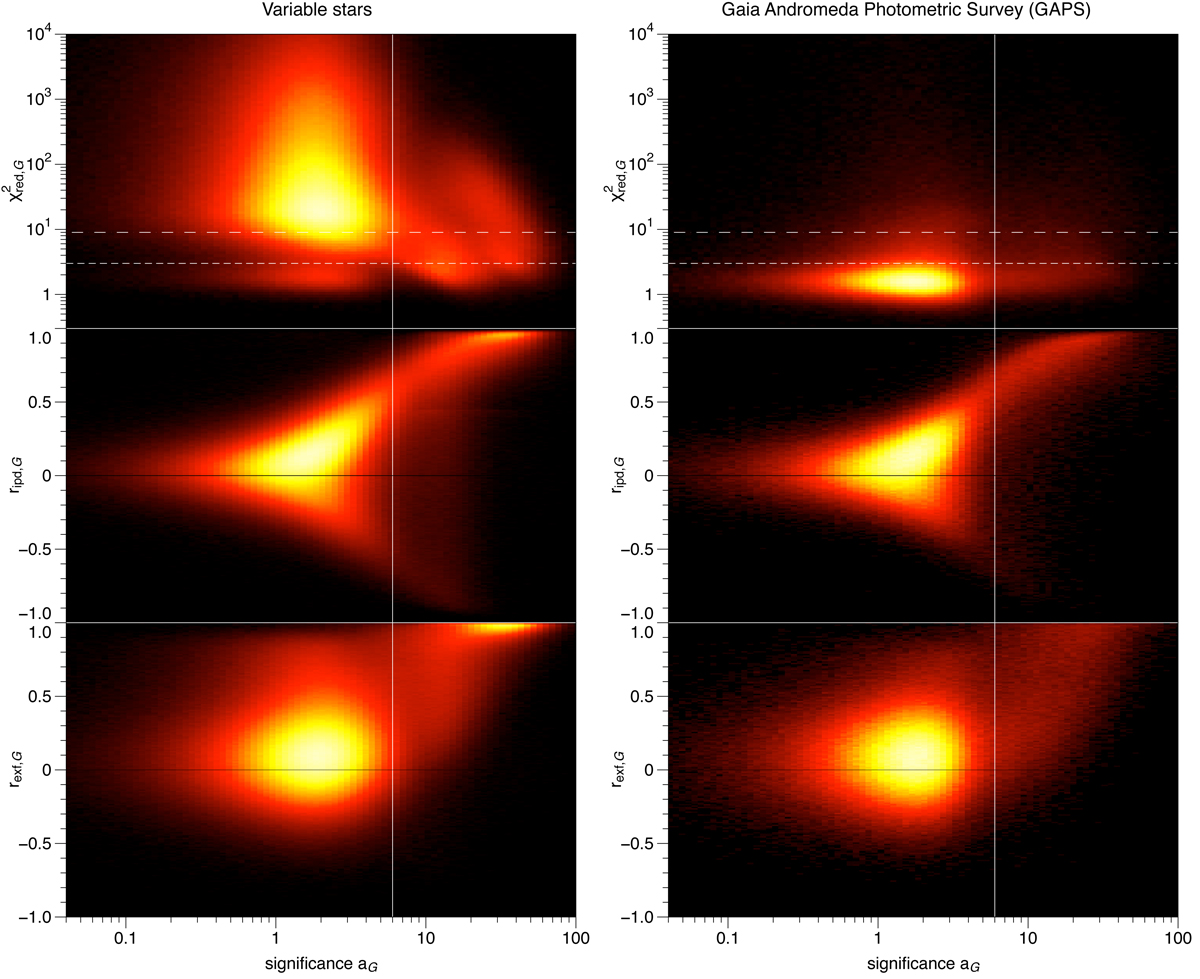
Fig. A.4.
Download original image
Density plots of various parameters in relation to the significance of aG, the amplitude of the small-separation binary model fit to the G-band photometry (Eq. 5). The white vertical line indicates a significance threshold of 6, above which the fitted amplitude is more likely due to a scan-angle-dependent signal. In the top panels, the same low ![]() thresholds as in Fig. A.3 are repeated at 3 and 9. The second and third panels show the strong relation between high-amplitude significance and high ripd, G or rexf, G, respectively (see Sect. 6.4 for further discussion). Plots for N3band ≥ 20 and NnoEpsl, G ≥ 20.
thresholds as in Fig. A.3 are repeated at 3 and 9. The second and third panels show the strong relation between high-amplitude significance and high ripd, G or rexf, G, respectively (see Sect. 6.4 for further discussion). Plots for N3band ≥ 20 and NnoEpsl, G ≥ 20.
Current usage metrics show cumulative count of Article Views (full-text article views including HTML views, PDF and ePub downloads, according to the available data) and Abstracts Views on Vision4Press platform.
Data correspond to usage on the plateform after 2015. The current usage metrics is available 48-96 hours after online publication and is updated daily on week days.
Initial download of the metrics may take a while.