Fig. A.3.
Download original image
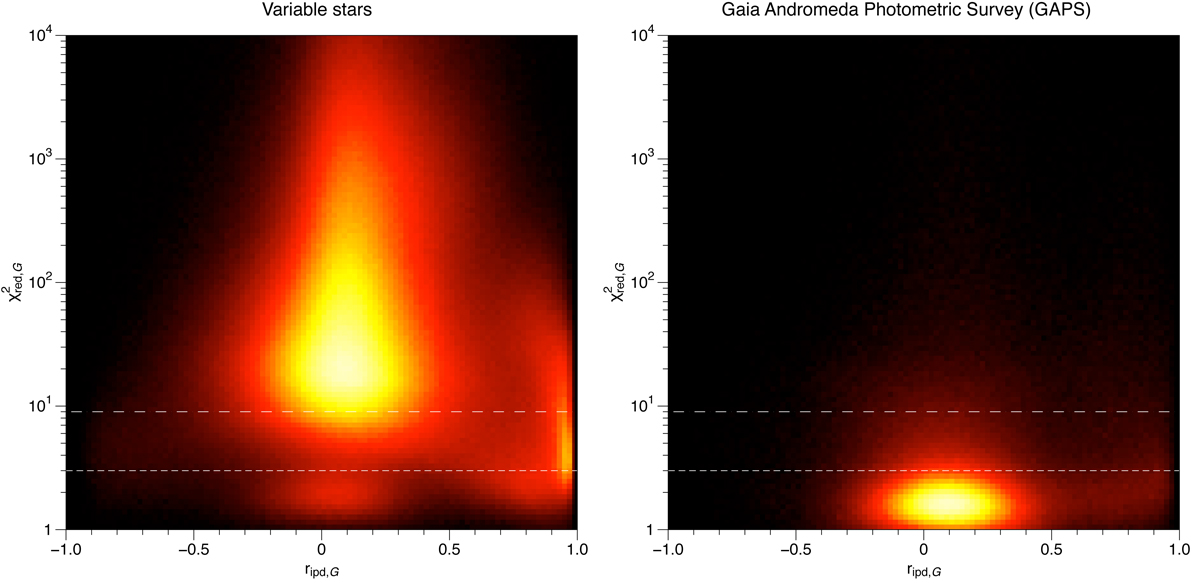
Density plot of the relation between ripd, G and ![]() of the small-separation binary model fit to the G-band photometry (Eq. 5). A low
of the small-separation binary model fit to the G-band photometry (Eq. 5). A low ![]() together with a high ripd, G suggests a strong scan-angle-dependent signal, while a low
together with a high ripd, G suggests a strong scan-angle-dependent signal, while a low ![]() in combination with a low correlation usually corresponds to non-variable (constant) stars with an insignificant amplitude, as seen (and expected) for the majority of the GAPS data set. As a guide for low
in combination with a low correlation usually corresponds to non-variable (constant) stars with an insignificant amplitude, as seen (and expected) for the majority of the GAPS data set. As a guide for low ![]() values, we added horizontal lines at thresholds 3 (short-dashed) and 9 (longer-dashed; see Sect. 6.4 for a more detailed discussion, and see also Fig. A.4 for the significance of the fitted amplitude). Plots for N3band ≥ 20 and NnoEpsl, G ≥ 20.
values, we added horizontal lines at thresholds 3 (short-dashed) and 9 (longer-dashed; see Sect. 6.4 for a more detailed discussion, and see also Fig. A.4 for the significance of the fitted amplitude). Plots for N3band ≥ 20 and NnoEpsl, G ≥ 20.
Current usage metrics show cumulative count of Article Views (full-text article views including HTML views, PDF and ePub downloads, according to the available data) and Abstracts Views on Vision4Press platform.
Data correspond to usage on the plateform after 2015. The current usage metrics is available 48-96 hours after online publication and is updated daily on week days.
Initial download of the metrics may take a while.