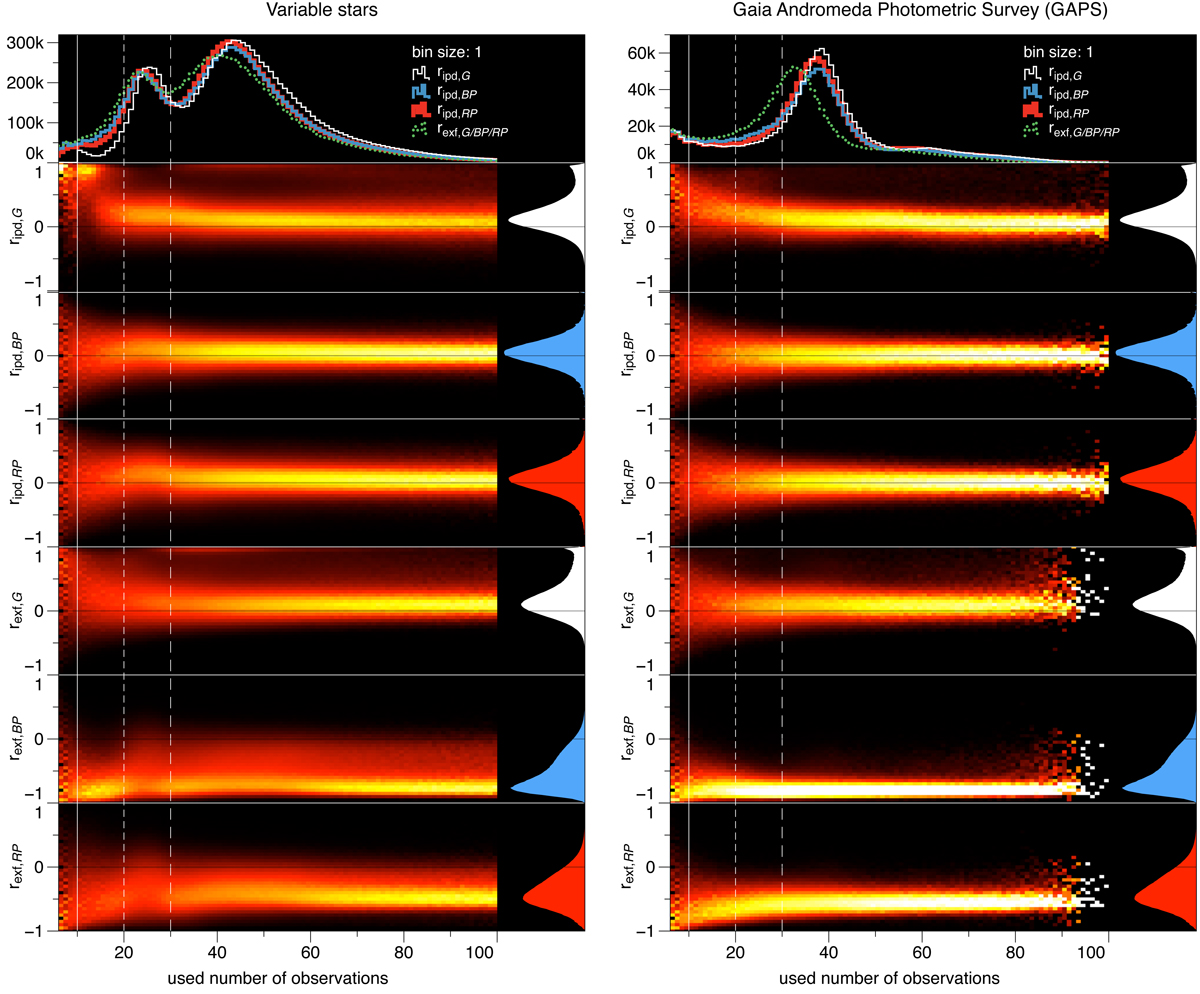
Fig. A.1.
Download original image
Correlations based on the published photometric time series in Gaia DR3. Top panels: Histograms of the number of available observations for the different correlation coefficients. Second to fourth panel rows: ipd correlation coefficients (Sect. 6.1). Fifth to seventh panel rows: Corrected excess factor correlation coefficients (Sect. 6.2). On the right side, a histogram illustrates the distribution of each correlation coefficient. The left panels contain the values for the 10.5 million variables, and the right panels show the values for the 1.3 million sources in GAPS. The heat maps are value normalised per number of observation bin to highlight the level of parameter spread. The histograms on the right sides represent the true count distribution for each parameter.
Current usage metrics show cumulative count of Article Views (full-text article views including HTML views, PDF and ePub downloads, according to the available data) and Abstracts Views on Vision4Press platform.
Data correspond to usage on the plateform after 2015. The current usage metrics is available 48-96 hours after online publication and is updated daily on week days.
Initial download of the metrics may take a while.