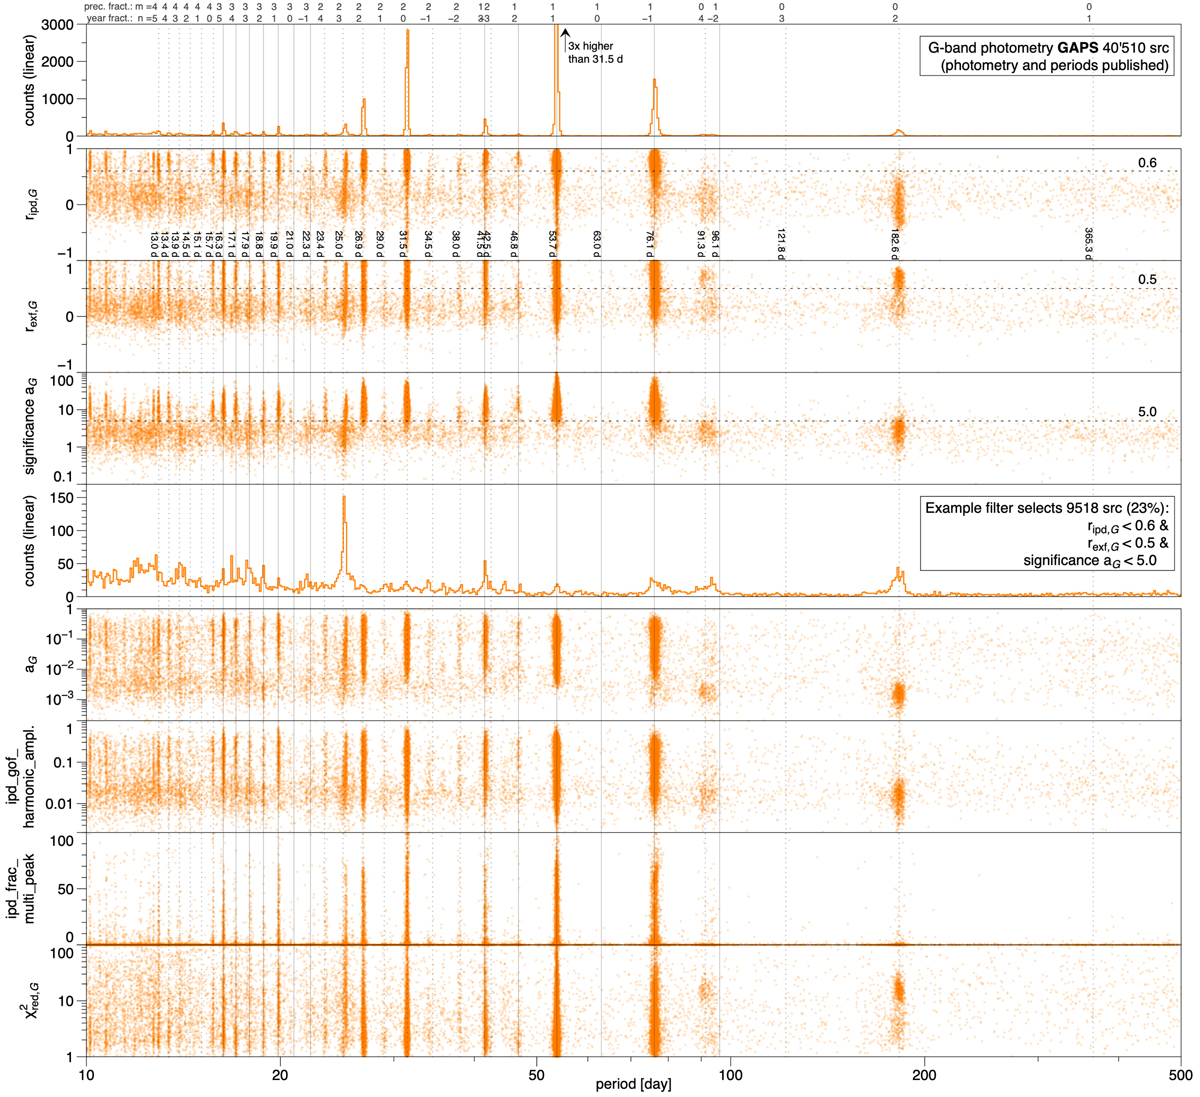
Fig. 28.

Download original image
Distribution of sources published in GAPS. The top panel shows the same data as in the second panel of Fig. 16. The following panels illustrate the distributions of various statistics that can be used to diagnose possible scan-angle-dependent signals; see text for details. An example filter has been created to show the effect on the period distribution. The total source counts are only for the period range of 10−500 d.
Current usage metrics show cumulative count of Article Views (full-text article views including HTML views, PDF and ePub downloads, according to the available data) and Abstracts Views on Vision4Press platform.
Data correspond to usage on the plateform after 2015. The current usage metrics is available 48-96 hours after online publication and is updated daily on week days.
Initial download of the metrics may take a while.


