Fig. 24.
Download original image
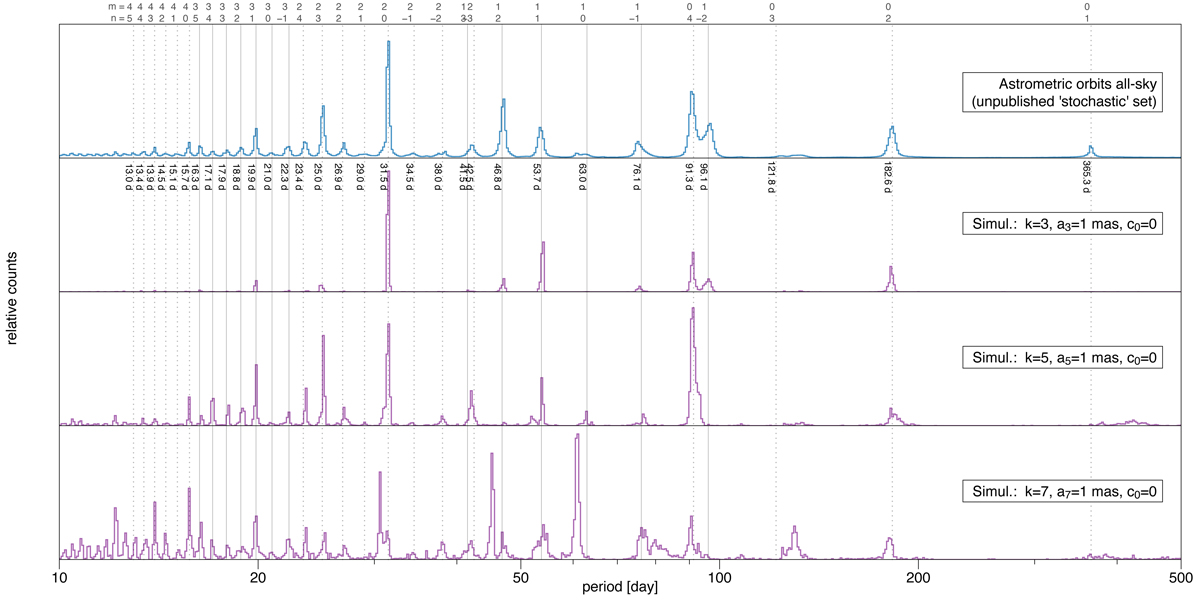
Comparison between the unpublished period distribution of an all-sky astrometric orbit sample (top panel, blue line, same as the bottom panel of Fig. 16) and that predicted by our fits to the noiseless sampled bias model of Eq. (7) for different scan-angle harmonics k (purple lines in the following panels). See Figs. C.6 and C.7 for ecliptic sky maps of the most prominent peaks.
Current usage metrics show cumulative count of Article Views (full-text article views including HTML views, PDF and ePub downloads, according to the available data) and Abstracts Views on Vision4Press platform.
Data correspond to usage on the plateform after 2015. The current usage metrics is available 48-96 hours after online publication and is updated daily on week days.
Initial download of the metrics may take a while.