Fig. 15.
Download original image
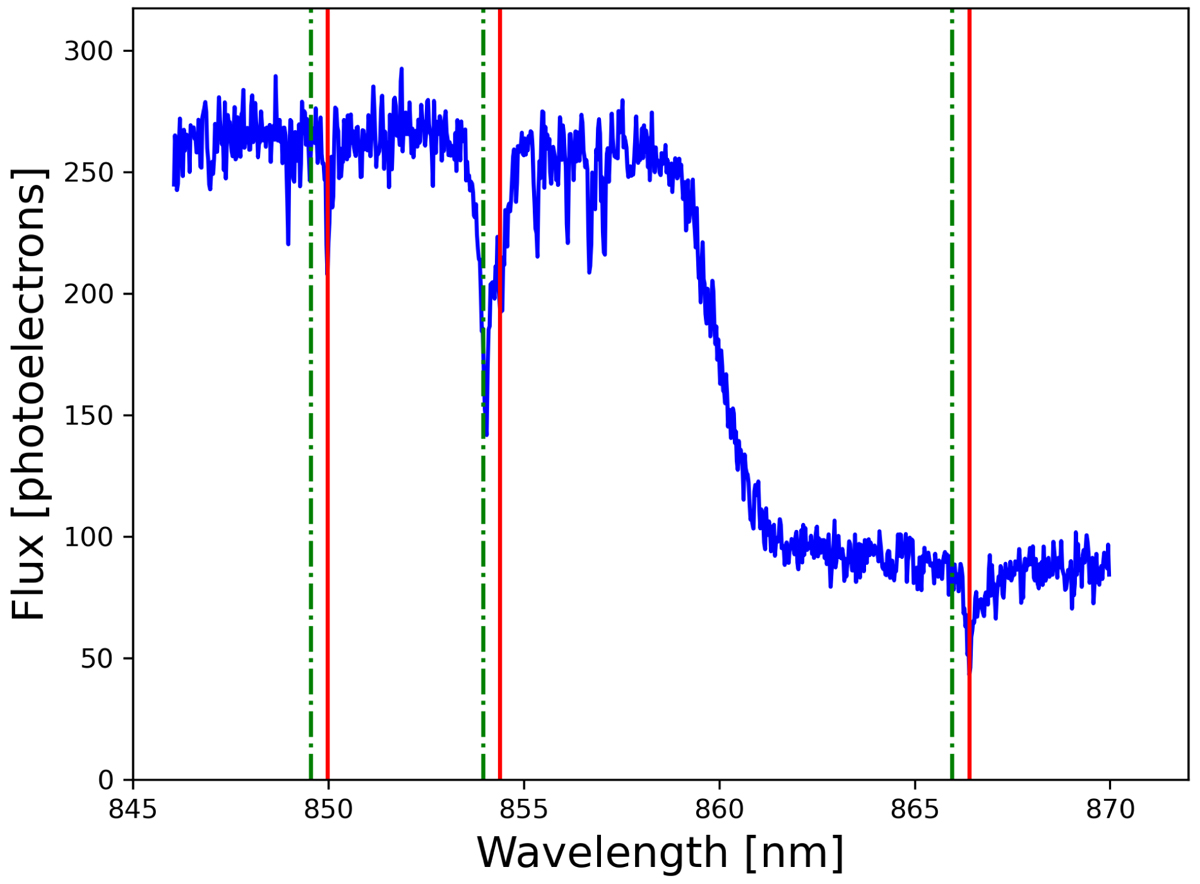
Spectrum of Gaia DR3 2006840790676091776, contaminated by the nearby source Gaia DR3 2006840790679122688 recorded in a transit. The solid vertical red lines show the real position of the Ca II triplet lines of Gaia DR3 2006840790676091776, and the dot-dashed green lines show the position of the same lines as found by the pipeline.
Current usage metrics show cumulative count of Article Views (full-text article views including HTML views, PDF and ePub downloads, according to the available data) and Abstracts Views on Vision4Press platform.
Data correspond to usage on the plateform after 2015. The current usage metrics is available 48-96 hours after online publication and is updated daily on week days.
Initial download of the metrics may take a while.