Fig. 14.
Download original image
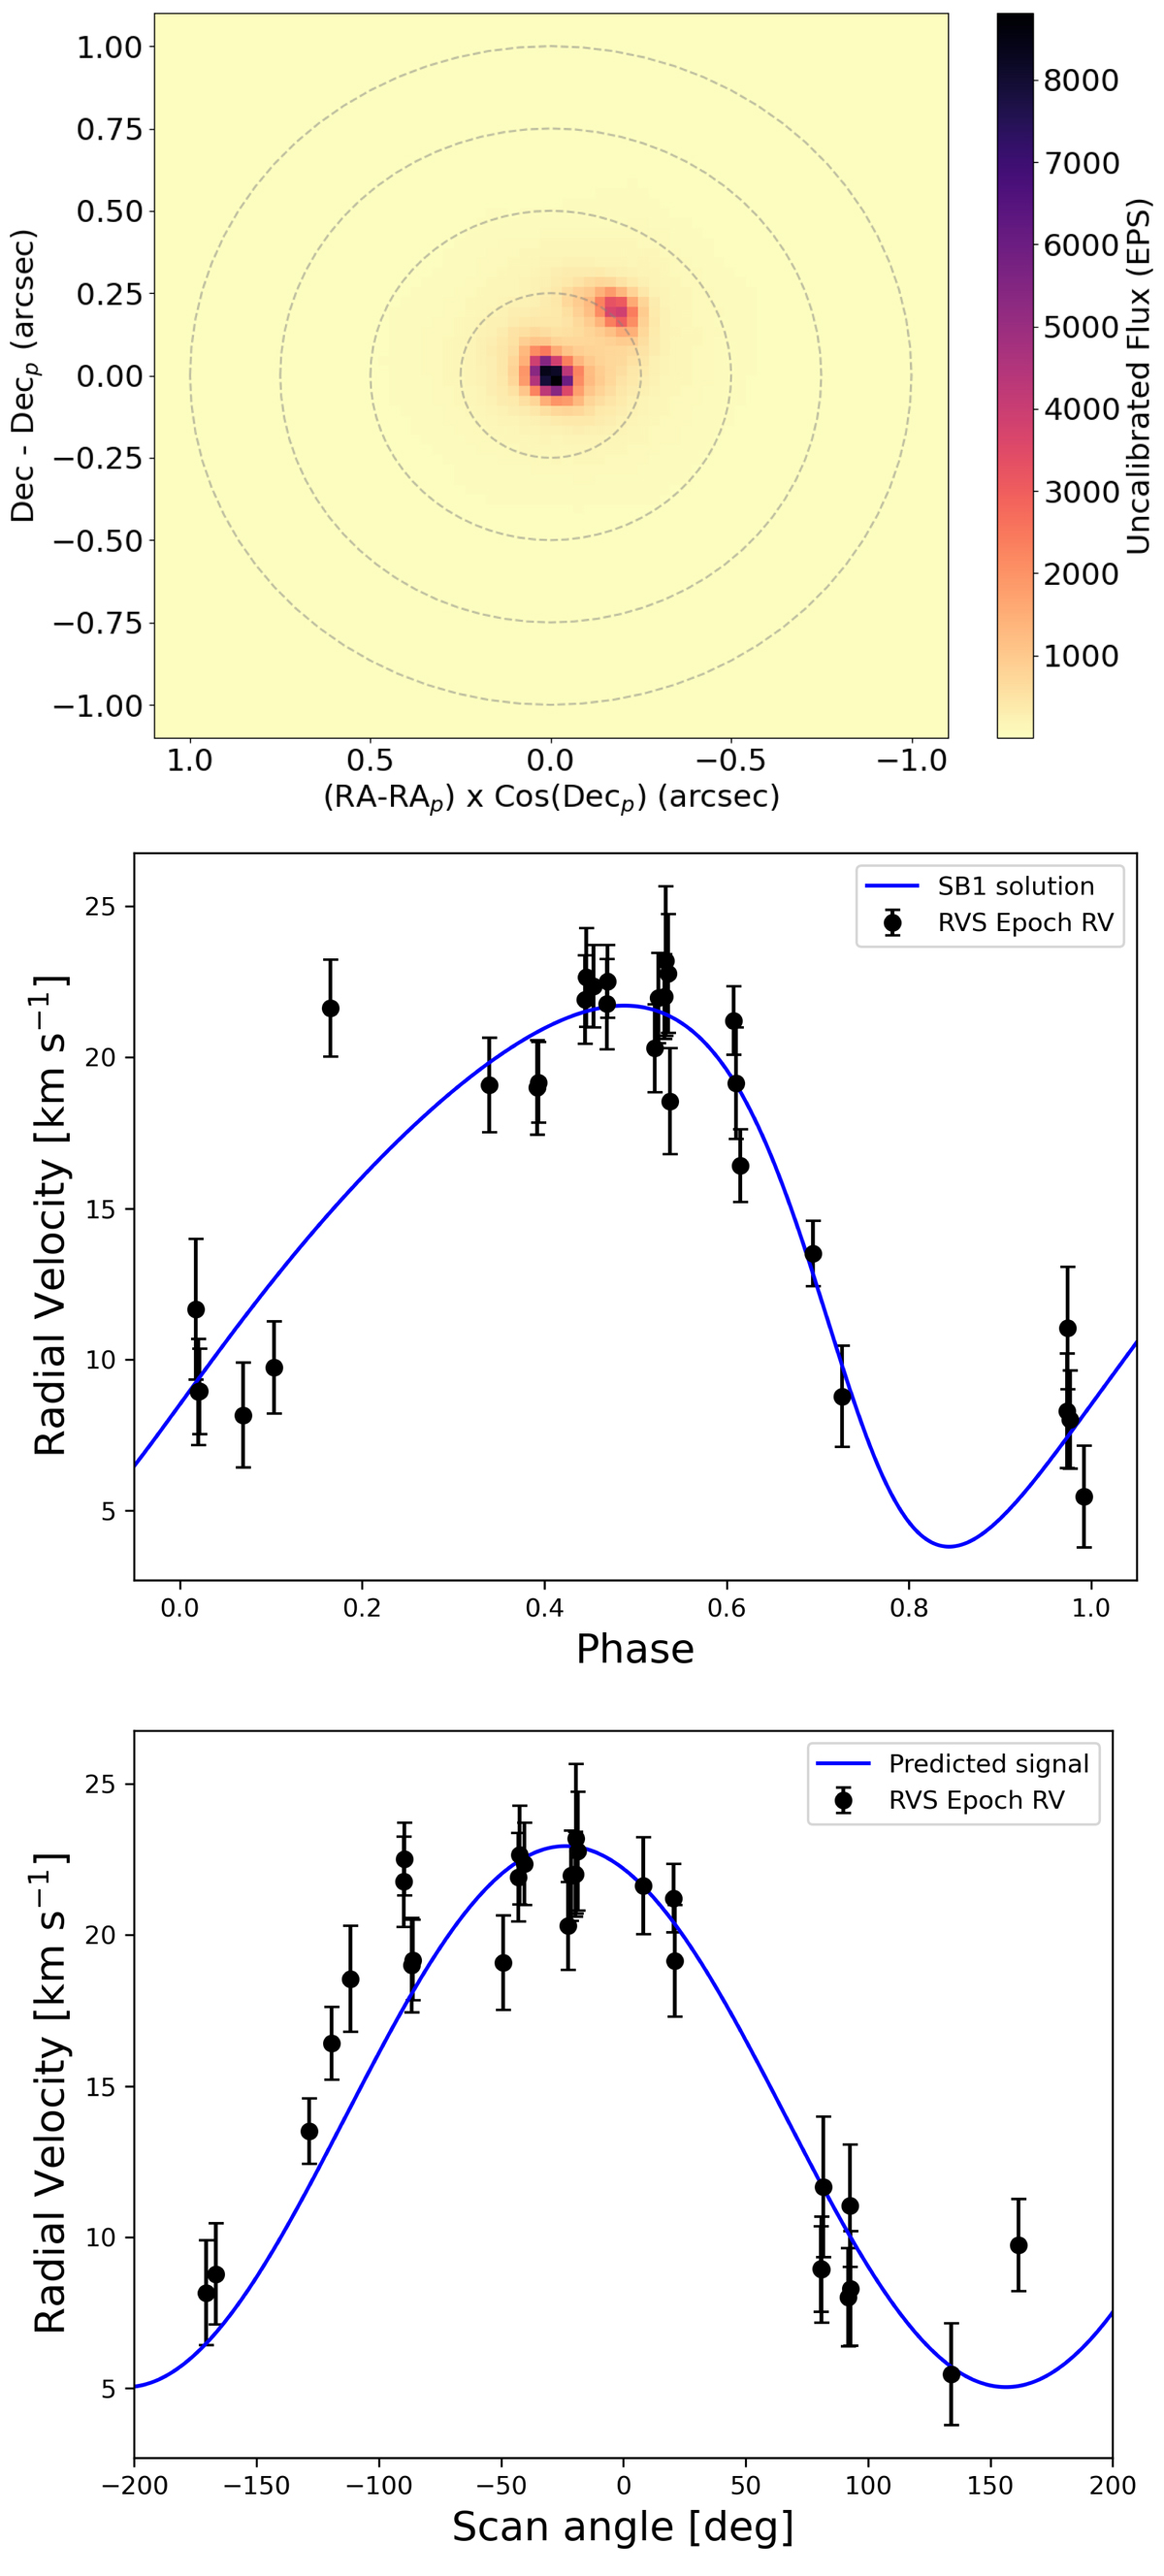
Top panel: image of the source Gaia DR3 5648209549925093504 produced by SEAPipe. Middle panel: RV data of Gaia DR3 5648209549925093504, folded in phase, as provided by the DR3 pipeline (black dots), compared with the SB1 solution provided in DR3 (blue line). Bottom panel: RV data as a function of the scan angle ψ, compared with a sinusoidal signal as predicted by Eq. (2).
Current usage metrics show cumulative count of Article Views (full-text article views including HTML views, PDF and ePub downloads, according to the available data) and Abstracts Views on Vision4Press platform.
Data correspond to usage on the plateform after 2015. The current usage metrics is available 48-96 hours after online publication and is updated daily on week days.
Initial download of the metrics may take a while.