Fig. 11.
Download original image
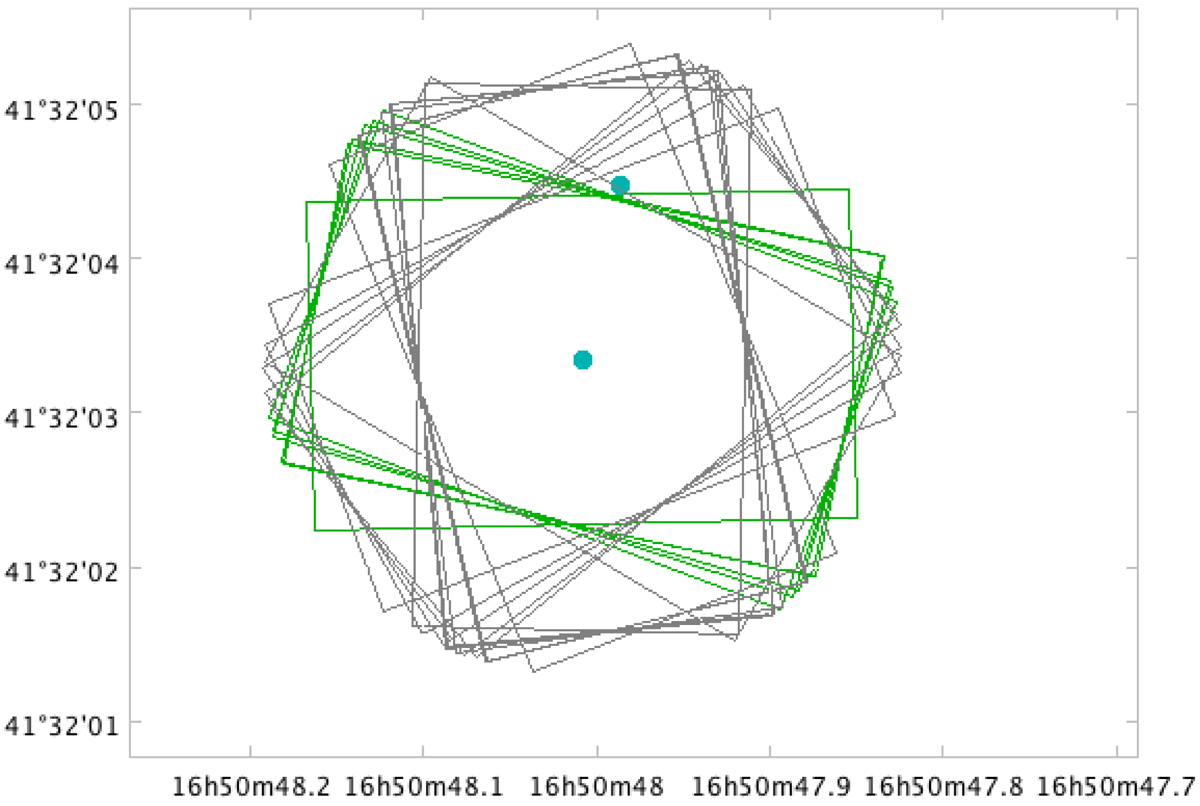
Example of two sources causing blended spectra in some of the observations. The rectangular shapes show the footprint of the observing window for real transits over one of the two sources. In the transits highlighted in green, the secondary source is located beyond the window, while both sources are inside the window for grey transits. The dispersion direction is along the major side of the observing window.
Current usage metrics show cumulative count of Article Views (full-text article views including HTML views, PDF and ePub downloads, according to the available data) and Abstracts Views on Vision4Press platform.
Data correspond to usage on the plateform after 2015. The current usage metrics is available 48-96 hours after online publication and is updated daily on week days.
Initial download of the metrics may take a while.