Fig. 3
Download original image
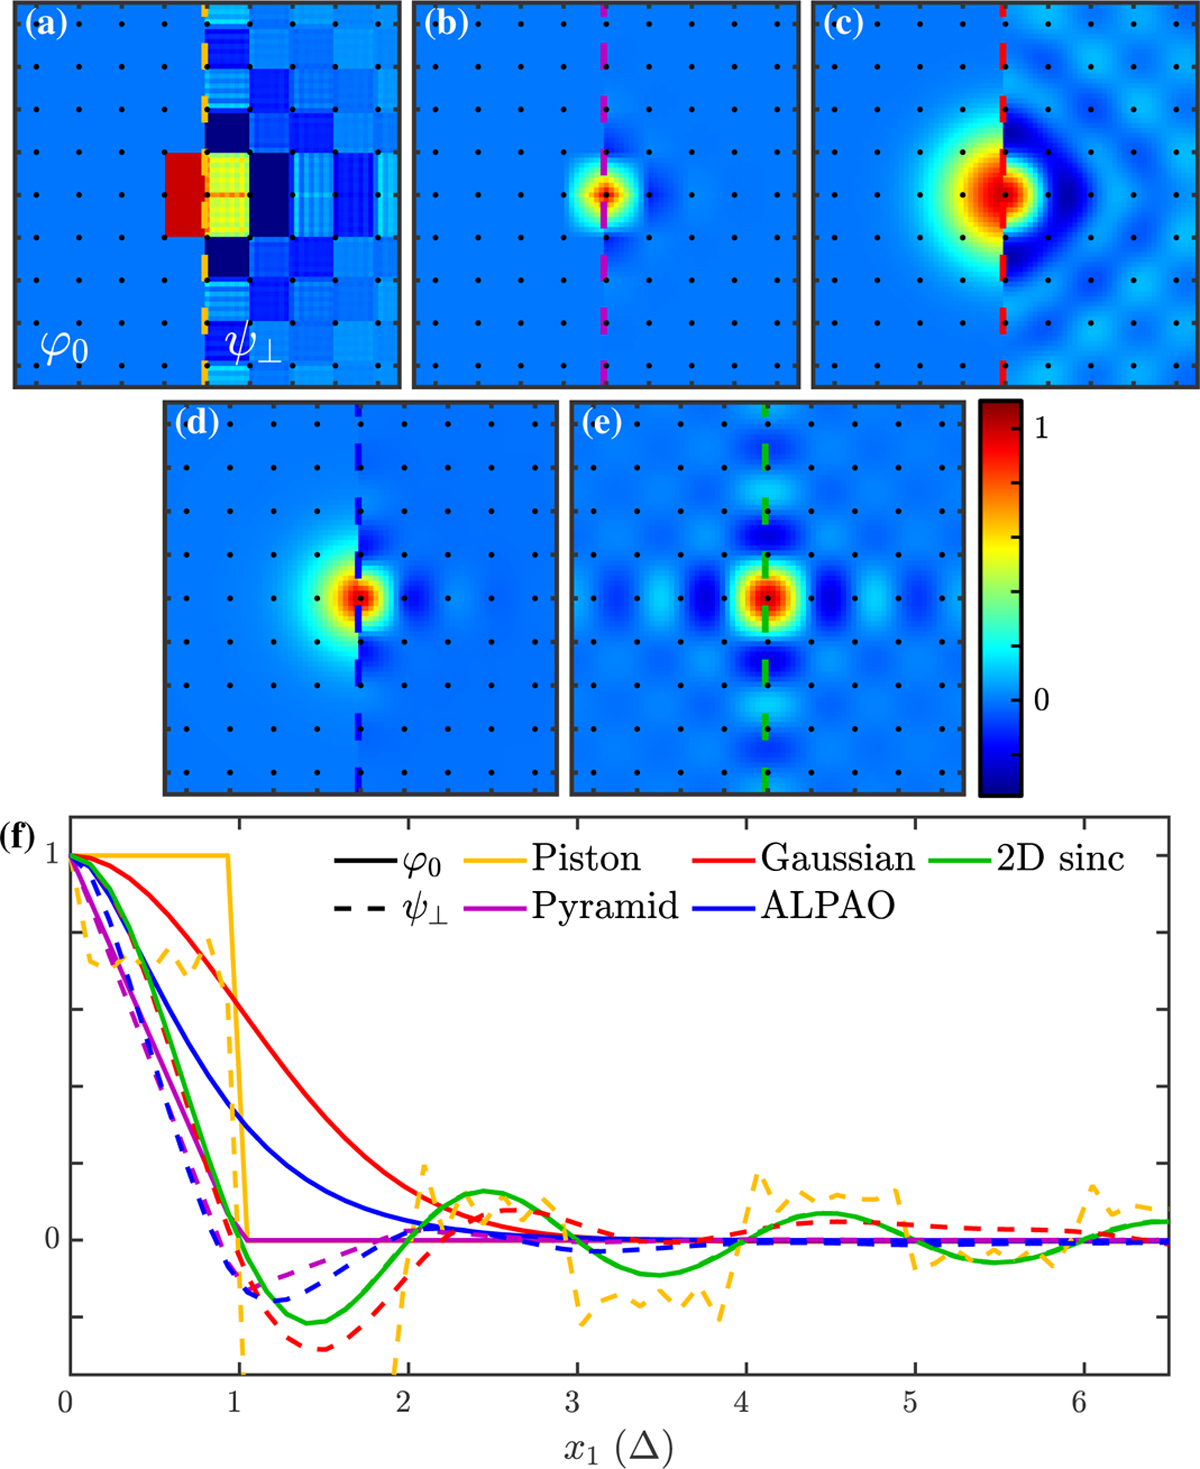
Visualisation of the different influence functions before (φ0 left side of the panels) and after (ψ⊥, right side of the panels) orthogonalisation for the different profiles. The 2D maps are normalised to their maximal value. Panel a: 2D local piston. Panel b: 2D pyramid. Panel c: 2D axisymmetric Gaussian profile. Panel d: 2D axisymmetric ALPAO profile. Panel e: 2D sine function. Panel ſ: x1 -profiles of the different influence functions before (solid lines) and after (dashed lines) orthogonalisation.
Current usage metrics show cumulative count of Article Views (full-text article views including HTML views, PDF and ePub downloads, according to the available data) and Abstracts Views on Vision4Press platform.
Data correspond to usage on the plateform after 2015. The current usage metrics is available 48-96 hours after online publication and is updated daily on week days.
Initial download of the metrics may take a while.