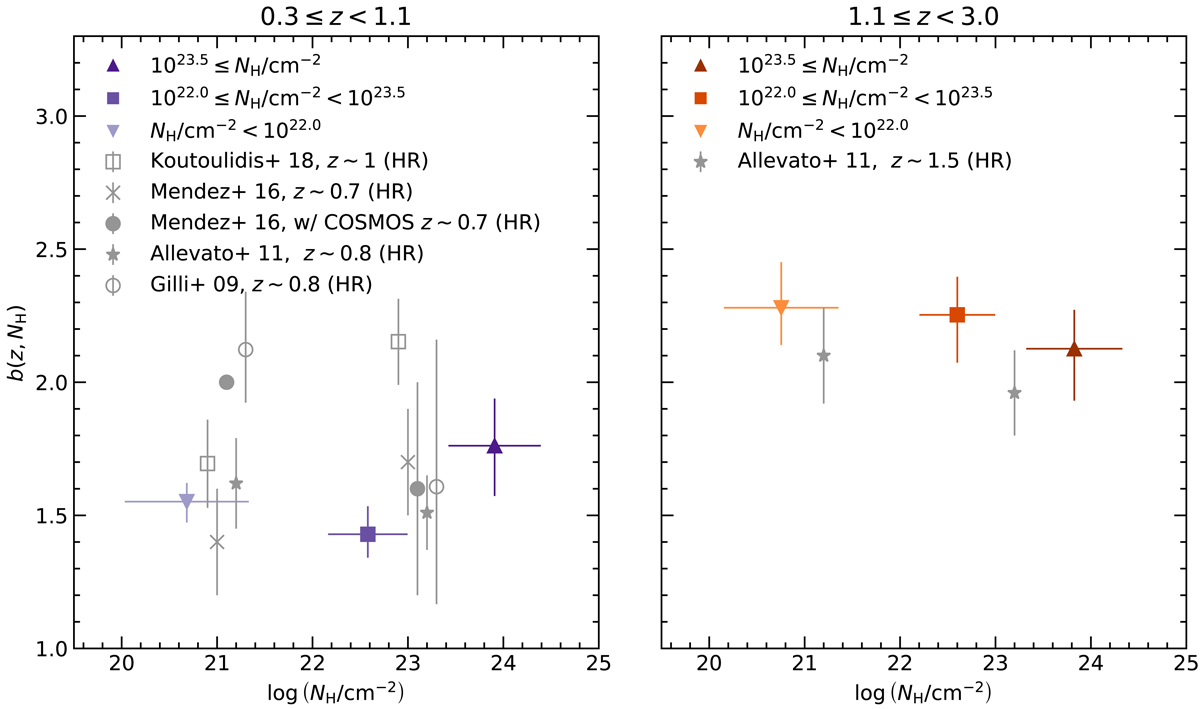
Fig. 3.
Download original image
Large-scale bias as a function of redshift (panels) and obscuration (markers in accordance with the legend). The vertical error bars correspond to the 16% and 84% quantiles of the best-fit bias using bootstrap resampling. The horizontal error bars show the 1σ of the NH distribution of the sample. Measurements from X-ray AGN clustering in terms of the HR at comparable redshifts are shown as gray markers in accordance with the legend (Gilli et al. 2009; Allevato et al. 2011; Mendez et al. 2016; Koutoulidis et al. 2018). Note that for plotting purposes we assume NH = 1021 cm−2 (NH = 1023 cm−2) for the soft (hard) samples and include a slight offset in NH for visual clarity. With open markers we show the bias based on the correlation length measurement, r0, assuming a power-law index γ = 1.8, as reported by Gilli et al. (2009), Allevato et al. (2011), Mendez et al. (2016), and Koutoulidis et al. (2018).
Current usage metrics show cumulative count of Article Views (full-text article views including HTML views, PDF and ePub downloads, according to the available data) and Abstracts Views on Vision4Press platform.
Data correspond to usage on the plateform after 2015. The current usage metrics is available 48-96 hours after online publication and is updated daily on week days.
Initial download of the metrics may take a while.