Fig. 2.
Download original image
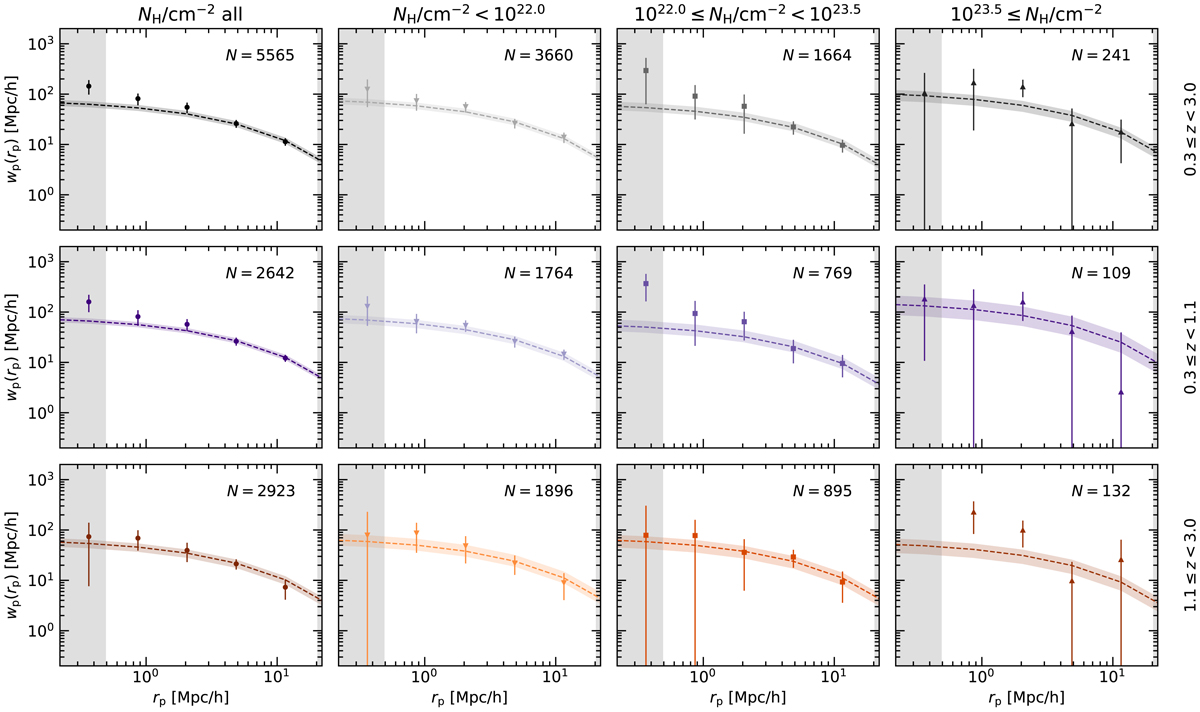
Measured two-point correlation function in redshift (rows) and obscuration bins (columns). Each figure shows the wp(rp), with error bars corresponding to the 1σ derived from bootstrap resampling. The best-fit weighted bias, ![]() , derived through the projected DM correlation function via wp(rp) = b2wp, DM(rp, z = 0) is shown as a dashed line with the same colors. The colored-shaded region corresponds to the 16% and 84% quantiles of the best-fit bias over the bootstrap samples. The shaded horizontal dark region corresponds to the rp not included in the bias fitting.
, derived through the projected DM correlation function via wp(rp) = b2wp, DM(rp, z = 0) is shown as a dashed line with the same colors. The colored-shaded region corresponds to the 16% and 84% quantiles of the best-fit bias over the bootstrap samples. The shaded horizontal dark region corresponds to the rp not included in the bias fitting.
Current usage metrics show cumulative count of Article Views (full-text article views including HTML views, PDF and ePub downloads, according to the available data) and Abstracts Views on Vision4Press platform.
Data correspond to usage on the plateform after 2015. The current usage metrics is available 48-96 hours after online publication and is updated daily on week days.
Initial download of the metrics may take a while.